The Dow Jones Industrial Average rose during its recent trading to intraday levels, to gain a second consecutive day of 1.31%, to gain around 423.78 points, and stabilize at the end of trading at the 32,827 level. , 01, after climbing 1.26% in trading on Friday.
The Dow was up more than 400 points on Monday, led by stock gains in Walgreens Boots Alliance Inc. WBA shares 4.10%, Salesforce Inc CRM 3.45%, Boeing Co. BA 3.06%.
Investors are now focused on Tuesday’s midterm elections, which will determine which party will control Congress, because there is a potential tax hike and any kind of massive spending is likely to be considered inflationary.
This week’s focus will also be on US consumer price data for October, arriving Thursday, looking for clues as to how rapid interest rate hikes by the US Federal Reserve are helping to cool the economy. .
Traders are divided on whether the Federal Reserve will raise interest rates by 50 basis points or 75 basis points at the US central bank meeting in December.
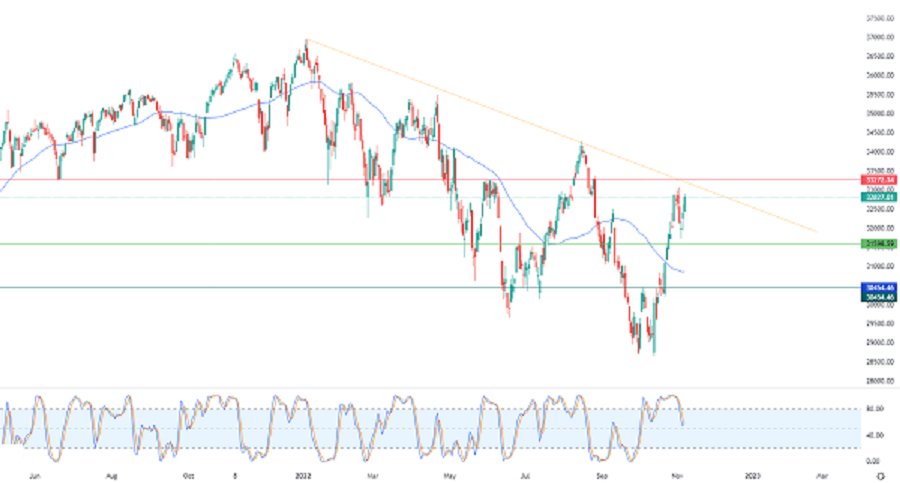
Technically, the upside of the index comes with the support of its continuous trading above its simple moving average for the previous 50 days, but in the face of this the index continues to move along a corrective downward slope line in the short term. , as shown in the attached graph for a period (daily), with the influx of negative signals on the indicators of Relative strength, after having reached previous areas of severe overbought.
The chart was generated by .platform TradingView
Therefore, our expectations still suggest a return to the decline in the index during its impending trade, during the stability of the important resistance level 33,272.30, to reach the first support levels at the level of 31,598.50.

