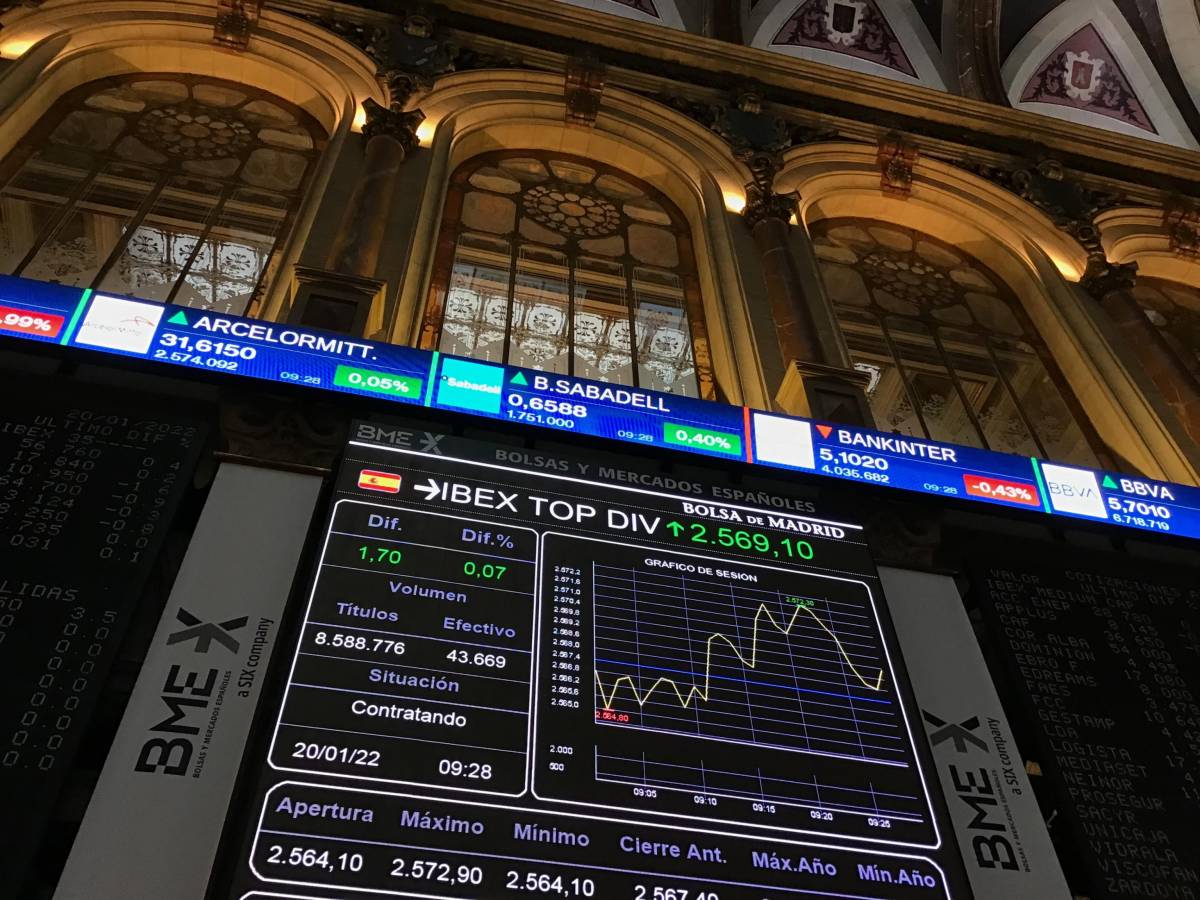
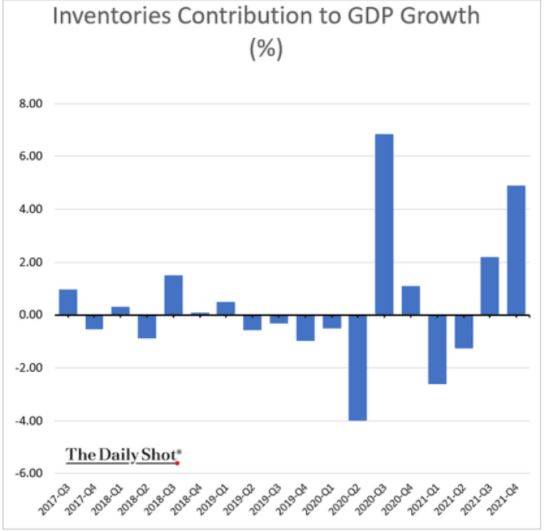
It’s amazing how now the very concept of financial press is exceeded by the speed with which information is disseminated and above all i prices. It happens to see websites or newspapers that for 24 or 48 hours keep updated articles posted at 17.30 on Friday afternoon, the closing of the Italian stock exchange, with negative views of the price trend when in reality at 22.00 on the same Friday Wall Street closed in enthusiastic manner. What is missing is the graphic overview combined with the macro-type information that hits the markets every day, it is true, but they have one characteristic: they are single-issue, single-issue like the concerns of market players that always oscillate within certain well-defined limits over a period of weeks. For example, now we ask ourselves whether US GDP growth will continue in the same way in 2022 and the concern is not so much about growth itself because, as the graph below demonstrates, this is higher than what we have seen in the last 40 years as it is about growth. components of the growth itself, which at the moment was driven exclusively by inventory increases but not by consumer purchases:
–
–
The question here is whether US consumers will be able to tear apart stocks that lie unsold in warehouses. Judging by the houses, it seems so, so much so that the price index of new houses has reached par with that of second-hand houses (single houses), which is a contradiction but the demand in the US for single houses is so strong. that even contradictions sometimes come true on the stock market. Many are reassured by the fact that in any case the growth of the USA if we take into account inflation is still below the long-term trend as shown by the following graph and therefore there is still room for a few years of calm on the front. of growth:

–
Then there is the inflation front that is dominating everywhere, so much so that by now the real market players, who are not financial operators but the CEOs of companies that produce real goods, take for granted a rise in prices and therefore in interest rates in the next 2022. But by foreseeing in this way they make the expectation come true because they react by raising prices and accepting wage increases from an increasingly difficult to find labor force. By now we are no longer used to positive real interest rates but this is normal and that is why we are witnessing in the USA and soon in Europe and in Italy the phenomenon of “getting out off the couch”, that is, purchases in the real estate sector driven by people who do not need a house now but have understood that if they will need it tomorrow then it is much cheaper to buy now.
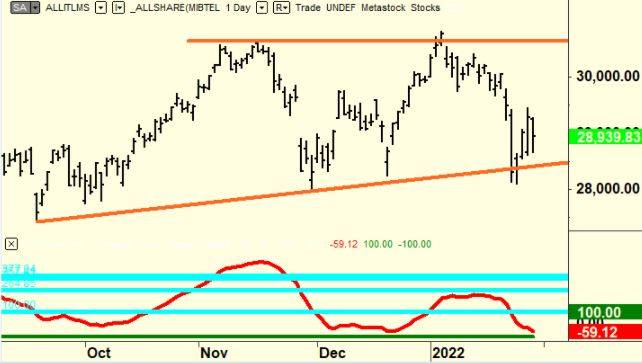
The complete picture of all these contrasting sentiments at a macro level, difficult to put together unless you are a really good conductor, can only be found in the stock market charts. And if we analyze the Italian Ftse All Share we see that it is building a bullish triangle with 3 minimum points and two maximum points for which the name of the pattern itself (“bullish” triangle) is comforting. Also note the MC Clellan which tells us that the number of Italian shares rising divided by the number of shares falling or unchanged is reaching a minimum point of fluctuation ready to restart.
—
On the Nasdaq 100 we have several bullish signals, both cyclical and graphical, including the excellent closing last Friday. It is evident that if Russia invades Ukraine, all this fine techno-fundamental analysis task would nevertheless be blessed …
But let’s do the traditional homework on Borsa Italiana shares.
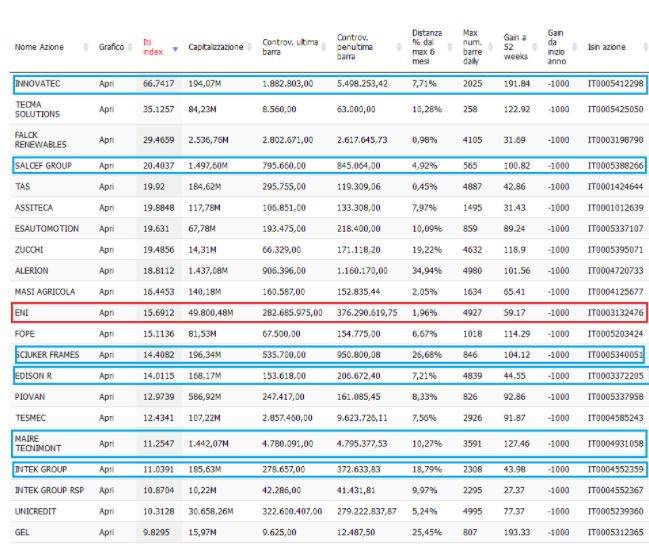
To love each other is to renew the same promise every day. And so, yes, we have to confess it: we love the Independent Trend Index. Our readers now know the ITI better than their neighbors, but it is still right to give a brief smattering of the latest arrivals: when we talk about the Independent Trend Index (for ITI friends) we are referring to an Independent Stock Exchange indicator. which measures the deviation between the actual price curve and the 45 ° growth, a dream of every investor.
In even simpler words, this ranking that automatically selects the best shares with more regular, stable and, consequently, reliable growth is free and can be viewed clicking here . The shares that can grow even beyond 100%, those that, except for particular cataclysms, hardly collapse overnight because they have a road built with solid foundations behind them. Every week thanks to the ITI we publish the analysis of a different action.
–
As always, in the table we have highlighted in blue the titles we have already talked about (you can find the articles by going down a bit on our home page) and in red the one we will talk about today: Eni shares.
—
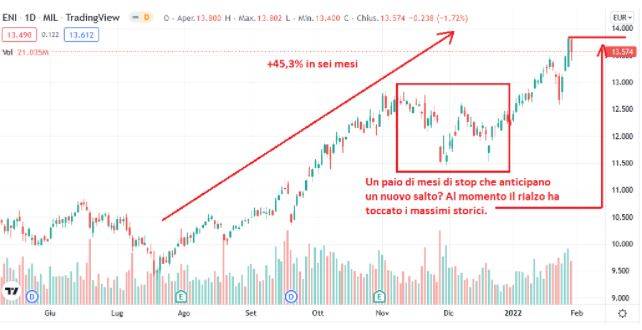
Eni shares: As we can see from the graph, the stock has grown by over 45% from July to today. Winter brought with it an uncertainty that stopped the race, soon wiped out since the beginning of 2022: can we consider it a pause before a new bullish rush? What is certain is that the recovery can be seen (the break of historic highs took place a couple of days ago) and volumes never give up (but this does not surprise us, a giant like Eni shares is never abandoned by institutional investors …).
The latest results regarding Eni’s accounts refer to the closure of the first nine months of 2021: the period ended with core business revenues of € 49.81 billion (+ 54% compared to the same period of the previous year) and an Ebitda of 5.86 billion euros, a sharp increase compared to the 1.41 billion obtained in 2020.
A few days ago the news came that Eni is preparing to list Var Energi on the Oslo Stock Exchange. At the moment the Italian company holds 69.858% of Var Energi and 100%, according to Sole24Ore, would be worth around 10 billion dollars.
The dates to check now, for those interested in Eni shares, are February 17, when the board of directors will meet to approve the preliminary results for 2021 and the forecast of the amount of the 2022 dividend, and March 17 for the approval of the 2021 financial statements and the dividend proposal.
–
–
