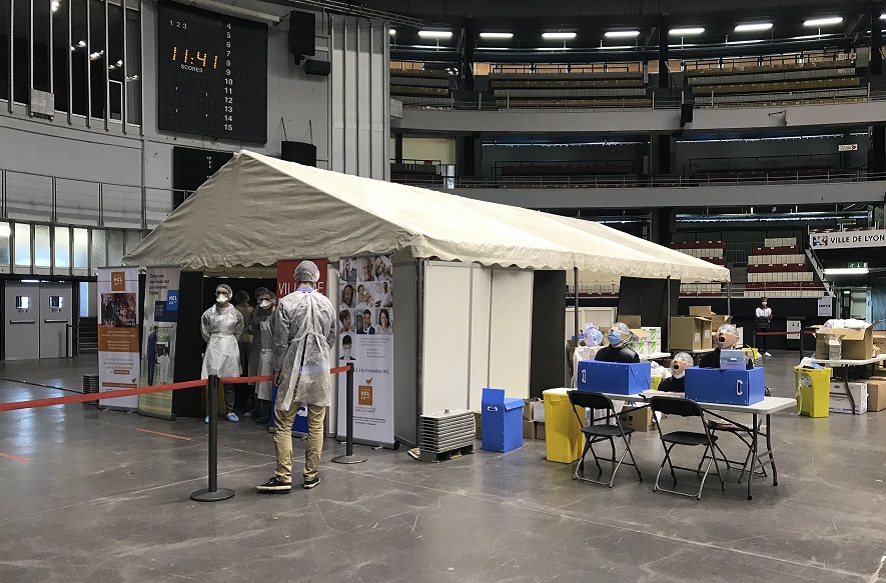
Coronavirus screening center at the Palais des Sports in Gerland.
–
The circulation of the virus is in very clear decline at the beginning of June in Lyon and in the Rhône. It has never been so low since the end of August in the department. The point this Monday in graphs and figures.
The circulation of the virus at time t in a territory is measured by the incidence rate. Policymakers have their eyes on it. It is a key indicator. The incidence rate determines the number of positive cases over the last 7 days per 100,000 inhabitants. On a slippery week. It is a very good way to measure the degree of circulation of the virus, at an instant t, on a territory.
In the Rhône department, according to the latest figures stabilized on Thursday, June 3, the incidence rate is 87 (the data therefore take into account the period between Friday, May 28 and Thursday, June 3). On April 4, at the height of the 3rd wave in the department, the incidence rate was still 504 in the Rhône department. The decline has been clear, and very clear, for two months. It’s simple, there had not been so few new cases in the Rhône department since the end of August (see the graph below).
The incidence rate, in the Rhône:
- 4 avril : 504
- 21 avril : 355
- May 4: 223
- May 21: 155
- June 3: 87
By age group, still in the Rhône, where we clearly see a “vaccine effect” in the oldest, the most vaccinated:
- Average: 87
- 10-19 years: 106
- 20-29 years: 127
- 30-39 years: 123
- 40-49 years: 108
- 50-59 years: 80
- 60-69 years: 41
- 70-79 years: 18
- 80-90 years: 29
- +90 years: 9
– .


