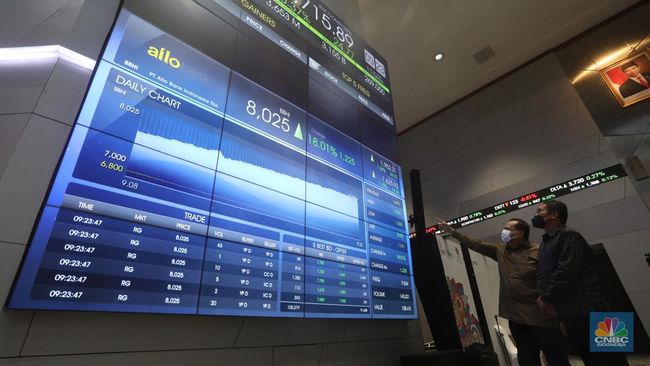
Jakarta, CNBC Indonesia – The Composite Stock Price Index (JCI) closed up 0.53% at 6,693.4 on Friday (14/1/2022) last week. Only 7 points less for the JCI to touch the psychological level of 6,700.
Even though it strengthened on Friday (14/1), the JCI performance tended to be corrected by 0.12% in the past week. Interestingly, foreign funds continue to enter the domestic stock market.
Trading data noted, there is no net buying action or net buy Rp 3.35 trillion in the regular market last week. The duo of big bank stocks, namely PT Bank Central Asia Tbk (BBCA) and PT Bank Rakyat Indonesia Tbk (BBRI) have become foreign targets with a net buy of Rp 1.2 trillion for the two shares.
For today’s trading, there are several sentiments that deserve investors’ attention. First, the development of global financial markets, especially Wall Street.
The New York Stock Exchange’s stock index ended last week’s trading with mixed performance. The Dow Jones Industrial Index fell 0.56%.
In contrast to the fate of the Dow Jones Industrial, the S & P 500 index slightly rose 0.08% while the Nasdaq Composite led the gains with an appreciation of 0.59%.
The increase in the price of technology stocks as reflected in the Nasdaq Composite index cannot be separated from its price performance which has been slammed in previous trading.
Investors took advantage of the moment of price correction to take action to buy, which contributed to a rebound in the index.
Domestically, there will be the release of economic data in the form of Indonesia’s trade balance for December 2021 from the Central Statistics Agency (BPS).
The consensus compiled by CNBC Indonesia estimates that exports can still grow 40.3% year on year (yoy) while imports are estimated to increase by 39.7% yoy. With this growth, the trade balance surplus is estimated to reach US$ 3.05 billion.
If you look at the performance of Wall Street, you can’t expect it to be a positive catalyst. Meanwhile, the trade balance surplus seems to have been priced-in by market players, so the impact should not be so strong to move the market.
So what are the prospects of the JCI movement for today? Here is the technical review.
Technical Analysis
JCI movement using the daily period (daily) of the Boillinger Band (BB) indicator through the method of the area of the upper limit (resistance) and the lower limit (support).
If you look at last week’s closing position, JCI needs to break the nearest support at 6,621 and then at 6,511 to form a bearish trend.
Meanwhile, to form an upward trend, JCI needs to break the nearest resistance level at 6,700 and then at 6,731.
If you look at the Relative Strength Index (RSI) indicator which shows increasing buying pressure, then the opportunity for the JCI to strengthen at least to the 6,700 level is actually open.
Please note, RIS is a momentum indicator that compares the amount of the latest price increase and decrease in a period of time.
The RSI indicator serves to detect overbought conditions above the 70-80 level and oversold conditions below the 30-20 level. Currently the RSI is in the area of 58.80.
When using another technical indicator that is the Moving Average Convergence Divergence (MACD), the EMA 12 line is still above the EMA 26 line.
On the other hand, the MACD indicator histogram bar is still in positive territory and tends to fall. This confirms that the opportunities for the JCI to increase are likely to be limited.
The index needs to break (break) one of the resistance or support levels, to see the direction of the next movement.
CNBC INDONESIA RESEARCH TEAM
(trp / dhf)
– .


