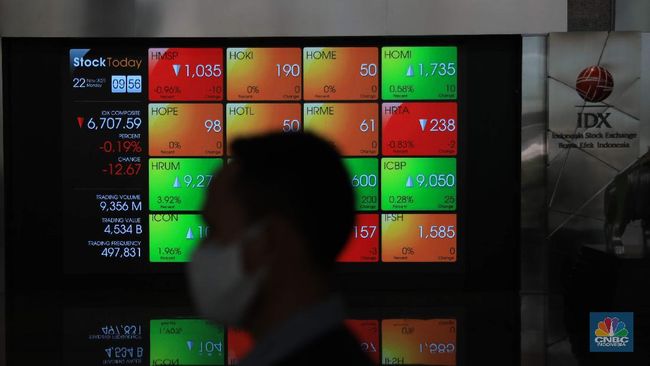
Jakarta, CNBC Indonesia – Even though it had set an all-time high of 6,754,464 on Thursday (25/11), the JCI actually fell 2.36% to 6,561,553 last week. The JCI slump actually occurred on Friday last week when it fell more than 2%.
The decline in the JCI followed other Asian exchanges that collapsed due to the emergence of a new variant of the corona virus B.1.1.529 or called Omicron which was first detected in South Africa, and has now been found in several countries including Hong Kong.
Scientists say Omicron is more contagious than other variants, and could reduce the effectiveness of the vaccine.
The World Health Organization (WHO) defines Omicron as a Variant of Concern (VoC).
It is feared that the emergence of Omicron will make many countries re-establish lockdwon. As a result, the global stock market plummeted. Wall Street (US/US stock exchanges) fell more than 2% in trading Friday last week. The Dow Jones led the slump of more than 2.5%, followed by the S&P 500 2.27% and the Nasdaq slumping 2.23%.
This risks causing the JCI to fall again in trading on Monday (29/11). Moreover, Omicron has now arrived in Australia, where last Sunday there were reported 2 positive cases of this latest corona virus.
Technically, the effects of the Doji and Shooting star duet patterns were immediately visible in Friday’s trading, the JCI fell by more than 2%. The Doji pattern was formed at the beginning of Monday (22/11) which gave a neutral signal. This means that market participants are still hesitant to determine the direction, whether to continue up or go back down.
|
Graph: JCI 1 Hour Foto: Refinitiv- – |
Then on Thursday (25/11), JCI, which failed to maintain a sharp strengthening, formed a Shooting Star pattern. This pattern is a signal of a reversal or reversal of the direction of the price of an asset.
JCI immediately fell back to below 6,600.
However, looking at the 1-hour chart, the JCI has a chance to rise if there is a gap (gap), even 2 gap. Technically the movement of an asset will usually close gap the.
In addition, the stochastic indicator has also reached the oversold area (oversold).
Stochastic is leading indicator, or indicators that initiate price movements. When Stochastic reaches the overbought (above 80) or oversold (below 20) territory, the price of an instrument has the opportunity to reverse direction.
It means when it reaches the territory oversold, JCI has the opportunity to rise. But once again the condition is to stay above 6,500 to 6,490 which is the 50-day moving average (Moving Average 50/MA 50). If this level is broken, the JCI could decline to 6,460, or even deeper.
As long as it stays above the 50 MA, JCI has the opportunity to strengthen and close the gap at 6,600. A break above it will open the opportunity for further upside today.
CNBC INDONESIA RESEARCH TEAM
(pap / pap)
– .

