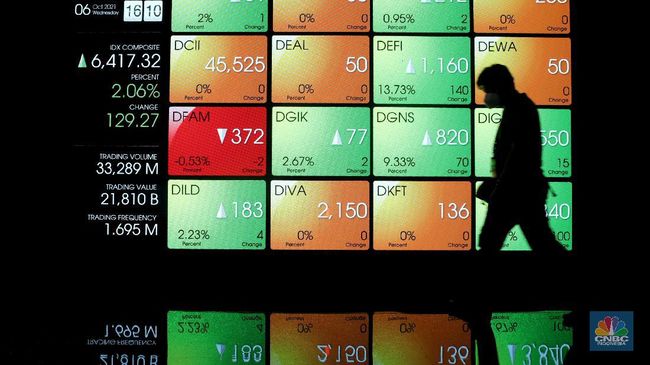
Jakarta, CNBC Indonesia – The Jakarta Composite Index (JCI) slumped 1.18% last Thursday to 6,524,076, foreign investors also made a net sale of Rp 467 billion in the regular market.
The net sell was the first after days of net buying. The JCI, which previously had the opportunity to break the highest record of all time, is now even further away after slumping in the last 2 days with a percentage of almost 2%.
Negative sentiment comes from China which is back doing lockdown in some areas, as well as the risk of default on property giants from Evergrande to Modern Land.
Bad news also came from the United States (US) yesterday evening. The US Commerce Department reported that US gross domestic product (GDP) grew only 2% in the third quarter of 2021, slowing from 6.7% in the previous quarter and lower than the results of a Reuters survey that predicted growth of 2.8%.
However, the US stock market (Wall Street) continued to strengthen, because the slowdown was predicted to be temporary. The S&P 500 and Nasdaq indexes were able to break all-time highs. But if you see the movement of the S&P 500 index and Nasdaq futures Friday (29/10) this morning which turned down due to disappointing earnings reports from Apple and Amazon, then Asian markets deserve to be wary, including the JCI.
Technically, the JCI finally declined in 2 consecutive days after the Stochastic indicator on the daily chart has been in the buy -saturated territory for a very long time (oversold).
Stochastic is leading indicator, or indicators that initiate price movements. When Stochastic reaches the territory overbought (above 80) or oversold (below 20), then the price of an instrument has the opportunity to reverse direction.
|
Graph: Daily JCI Foto: Refinitiv- – |
Now, the stochastic is already out of oversold territory, so the downward pressure is slightly reduced.
In addition, the JCI movement on Tuesday (26/10) formed the Dragonfly Doji pattern which became a reversal signal.
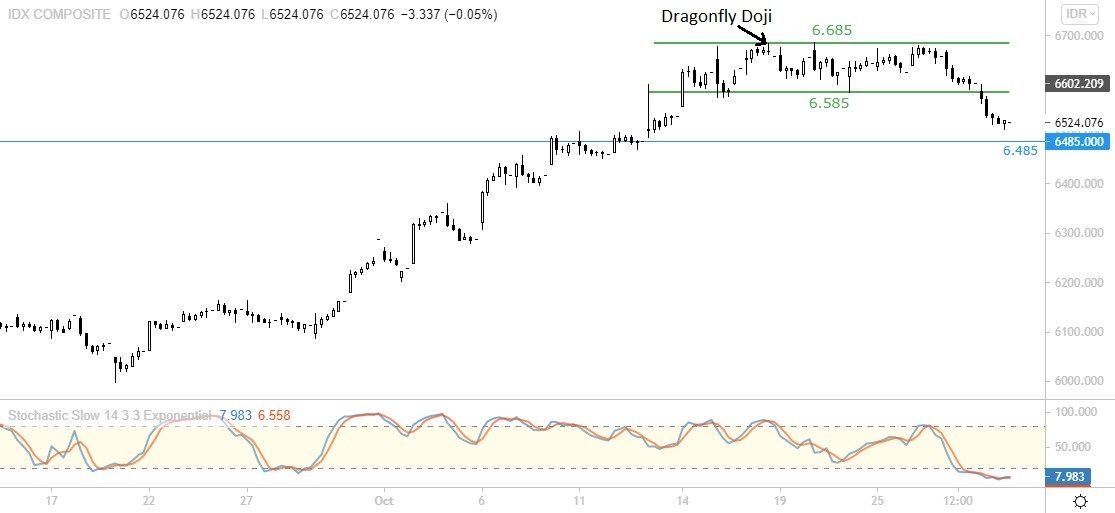
On the 1-hour chart, the Dragonfly Doji also appeared on October 18th, since then the JCI has been difficult to record significant gains, and has even tended to fluctuate, until it finally slumped in the last 2 days.
In addition, JCI is now forming a Recatangle pattern on the hourly chart. This pattern is a sideways indication, and the lower limit has been breached.
 Graph: JCI 1 Hour Graph: JCI 1 HourFoto: Refinitiv- – |
The lower limit of the Rencangle pattern is in the range of 6.585 and the upper limit is at 6685, which means that there is a gap of 100 points. When the lower limit is crossed, the JCI declines target to 6,485, on the other hand, if the lower limit is penetrated, the JCI risks falling to 6,475, which is the closest target for today’s decline. If this level is broken, the JCI is at risk of falling again.
But, as long as it stays on top of it, the JCI has a chance rebound see hourly Stochastic in the region oversold.
The closest resistance is at around 6,550, if it passes the JCI has the chance to rise to 6,585 to 6,600.
CNBC INDONESIA RESEARCH TEAM
(pap / pap)
– .


