Trend-following, mean-reverting, breakout, overbought, and oversold. When it comes to markets, it is not uncommon to hear these terms, but they often create more confusion than clarity. Let’s try to simplify it.
What is a trending market and what is a congested market? Often in my editorials I talk about these two concepts and I periodically receive emails from readers asking me to explain the quid and the quare.
“Trend following” indicates a market inclined to continue the current trend: if it has touched a new high, it will tend to continue to rise, if it has touched a new low, it will probably continue to fall. The strategies used in these types of markets generally buy when the price is high, and try to make money by “getting on the horse already in the running”.
If you want to learn more about the concept of trend following, watch this video on breakout system >>
A “mean reverting” market, in Italian “that returns to the average”, behaves in the opposite way. When approaching a maximum or a minimum, the market will tend to reverse course, and return to average prices. A mean reverting strategy buys when the trend is bearish, and therefore when the price is lower than the average, and then resells after a future reversal that causes the price to rise.
In the following image we show how it is possible near a maximum to open the door to both possibilities: there are stocks that have a tendency to break the previous relative maximums (exceed the red rectangle) and others that have a tendency to touch the red rectangle and then back down.
–
But how to apply this information in practice? By knowing which markets are trend-following and which are mean-reverting, you can choose the best strategy to use.
To identify the nature of some markets, we carried out tests on the FTSE Mib 40, the FTSE Star, and on commodities: we applied two systems to the markets of interest, the first that gains if the market is trend-following and loses money if the market is mean-reverting, and the latter doing the exact opposite. The result reveals that FTSE Star is a mean-reverting market, while FTSE Mib 40 and, even more, the commodities market, are trend-following.
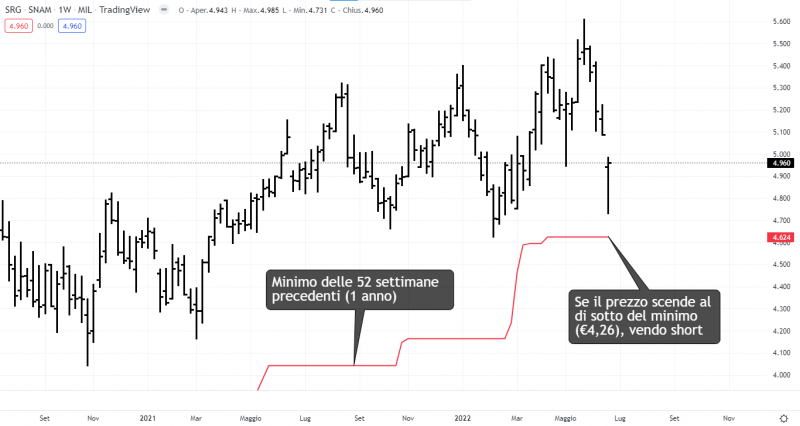
If today we wanted to follow a trend-following strategy on Italian stocks, we should keep an eye on SNAM (SRG), which is close to breaking the low of 52 bars, which is the lowest price of the last year. In this case, note that the possible break is a minimum, not a maximum, so instead of buying, we will sell short SRG when the price falls below € 4.62. However, remember that statistically a short trade, with this strategy, is less likely to succeed than a long trade.

–
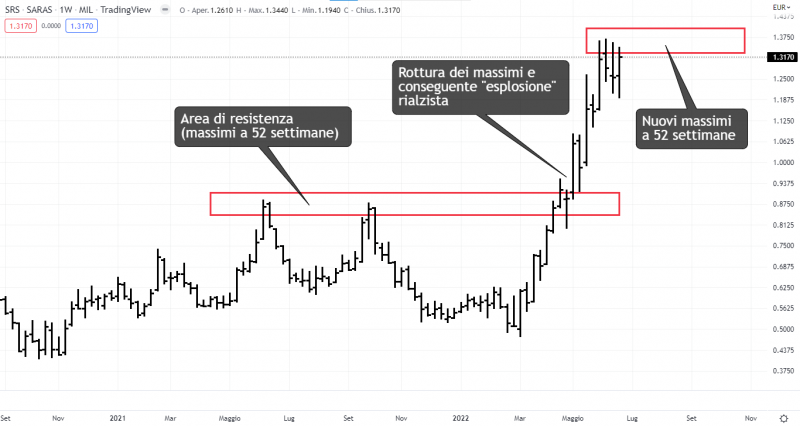
Another interesting stock is SARAS (SRS), which, after breaking the annual highs between the end of April and the beginning of May, has prolonged the bullish impulse towards new highs. The highest price of the last year was recorded the week of June 6, touching € 1.37. Following the trend following strategy, we would have already rode the bullish wave, and now we would be waiting for a break of the new high of € 1.37, confirming the bullish trend, to expand our position.

–
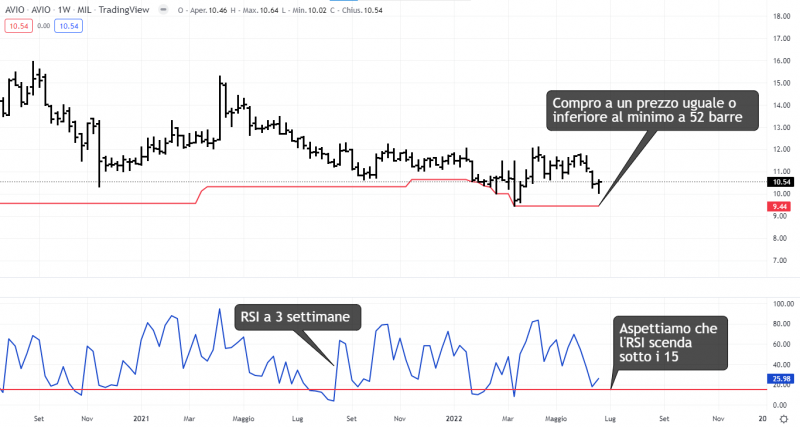
If, on the other hand, you think you are more inclined to use a mean reverting strategy, you can keep AVIO (AVIO) under control: in this case the RSI, a very common technical indicator created by the great Welles Wilder, is about to identify an oversold condition. Furthermore, the price is close to the last 365 days low, a second condition that can reinforce the idea of a price reversal, since AVIO is a stock in the FTSE Star index, which, as we said before, is mean reverting in nature. Before buying, we wait for the RSI to fall below the value of 15, and for the price to get closer to the low of € 9.44, in order to capture as much profit as possible after the eventual reversal.

–
However, remember to always set a stop loss for your open positions. A stop loss of around 7% is well suited to these types of strategies.
(Marco Cavallari collaborated)
–

