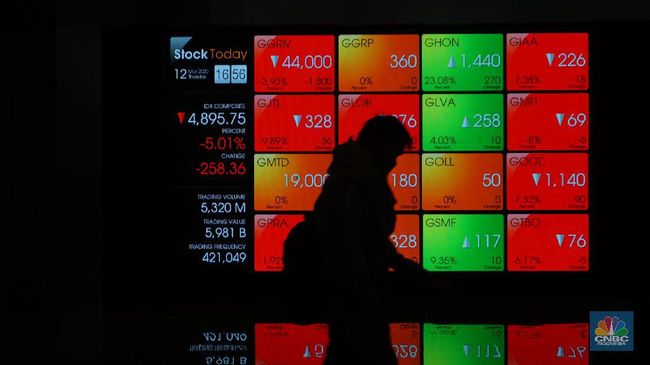
Jakarta, CNBC Indonesia – The Composite Stock Price Index (IHSG) had strengthened by almost 1% at the start of trading, but in the end it had to be willing to return to the red zone, weakening 0.33% to 4,917.95. Today the JCI is still potentially under pressure from the effects of the spread of the corona virus (covid-19)
Trade data noted that foreign investors made net selling of Rp 187 billion on the regular market with a transaction value of Rp 7 trillion.
The negative sentiment still came from the risk of recession in Indonesia, which was expressed by Minister of Finance Sri Mulyani.
In addition, more and more Indonesians have fallen ill and died from the virus that initially spread in Wuhan City, Hubei Province, People’s Republic of China.
As of September 23, 2020, the number of positive corona patients in the country was recorded at 257,388 people. Increased 4,465 people (1.77%) compared to the previous day’s position. The addition of 4,465 new patients a day is the highest record since Indonesia recorded its first case in early March.
In the last 14 days (10-23 September), the average addition of new patients was 3,860 people per day. Far above the previous 14 days, namely 3,084 people per day.
Meanwhile, externally, it was influenced by the statement of the boss of the central bank of the United States (US) or the Fed and his colleagues.
The pressure was getting bigger for JCI in trading today, Thursday (9/24/2020), due to the United States stock exchange which experienced a sell-off Wednesday local time. Global gold prices also fell, which triggered the risk of a broad sell-off like last March. At that time the JCI had collapsed by more than 30%.
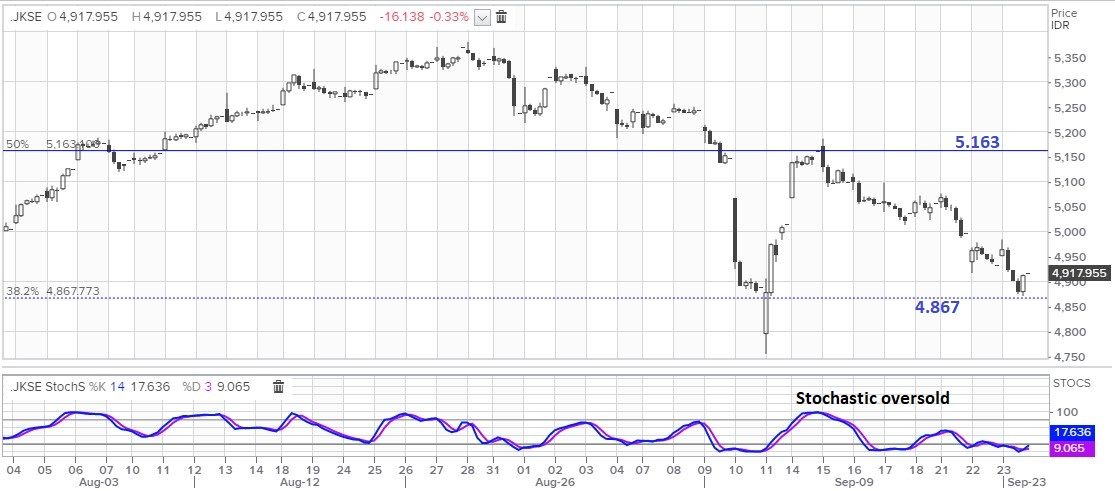
Technically, JCI weakened yesterday and almost reached the target of the decline of 4,867 which is Fib. 38.2% retracement on the daily chart.
The fiber pulled from a September 2019 high of 6,414 to this year’s weakest level of 3,911 on the daily chart.
The stochastic indicator on the daily chart is moving lower towards the oversold area (oversold).
|
Graphic: Daily IHSG Foto: Refinitiv- – |
Stochastic is leading indicator, or indicators that initiate price movements. When Stochastic reaches the overbought area (above 80) or oversold (below 20), the price of an instrument has a chance to reverse.
With the stochastic not yet oversold, it means that the JCI is still wide open.
The 4,867 area is the closest support, if it is successfully broken, the selling will increase bringing JCI down to 4,700.
 Graph: IHSG 1 Hour Graph: IHSG 1 HourFoto: Refinitiv- – |
Meanwhile, if it stays above support, JCI has the chance to rise. Looking at the hourly chart, the stochastic indicator is already in the oversold area. The closest resistance is at 4,970, if the JCI is passed it has the opportunity to strengthen to the psychological level of 5,000.
CNBC INDONESIA RESEARCH TEAM
(pap / pap)
– .


