
Differentiate between traditional businesses and autoentrepreneurs who have become micro-entrepreneurs, which is moreover a term with various definitions.
Differentiate traditional businesses from autoentrepreneurs who have become micro-entrepreneurs, which is moreover a term with various definitions, differentiate the legal units (the most widely used definition) of the business within the meaning of the law on the modernization of the economy, all definitions which include or exclude more than one million businesses.
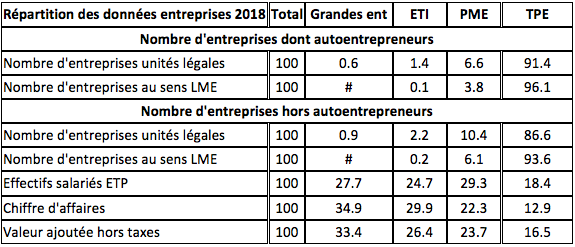
Companies according to size categories and according to the definition of the term company
Since the Business Modernization Law, we differentiate between 2 definitions for dealing with businesses, the legal unit which defines any business registered regularly and the business within the meaning of the LME law where in particular the “subsidiaries” are grouped together with the parent company, very usual situation for large companies or ETI (84 legal units respectively for large companies and 10 for ETI against 2 for SMEs and 1.02 for VSEs).
Hence the difficulty in expressing the weight of VSEs or SMEs in the number of total businesses, depending on the definition of the business chosen and whether or not autoentrepreneurs are included.
If we consider the total number of companies relating to the non-agricultural and non-financial market sectors, including autoentrepreneurs (or microenterprises), the number of legal units at the end of 2018 was 4.190 million, that within the meaning of LME 3.934 million. If we exclude autoentrepreneurs, the legal unit companies are then 2.521 million and the companies within the meaning of LME 2.280 million. However, most studies, including from INSEE, rarely specify the definition used when dealing with businesses!
Thus the weight of TPE varies from 86.1 to 96.4% depending on the definitions used.
–
Some essential data for mid-sized companies and SMEs
ETI
In 2018, France had 5,400 medium-sized companies (ETI) which employ 3 million FTE employees, and achieve 30% of turnover, 29% of investments and 26% of the added value of all companies. . On average, they employ 560 people and have 10 legal units. Almost all mid-cap companies belong to a group, with only 6% of mid-cap companies being independent.
They stand out from other categories of companies by their orientation towards the manufacturing industry (36% of their employees and 38% of employees in the industry), and by the weight of exports (33% of their turnover). business) and their foreign establishments (26% are multinationals under foreign control vs. 30% of large companies); 28% of employees in mid-sized companies represent half of the employment of foreign establishments in France.
Multinational mid-cap companies are larger and more capital intensive. Excluding the financial and real estate sectors, multinational mid-size companies under French control employ an average of 757 employees (in FTE) on the national territory, and those under foreign control 612; French mid-size companies employ 393 on average.
MNEs under foreign control have more tangible fixed assets per employee than those under French control (excluding real estate companies, which are atypical by the nature of their assets). They also generate higher added value per employee; they also pay higher salaries, with a gap of 13% compared to those of multinational mid-sized companies under French control and of 46% compared to those of French mid-sized companies.
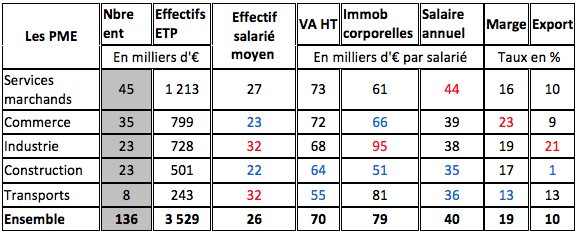
SMEs and VSEs
In 2018, France had 3.9 million small and medium-sized enterprises, including autoentrepreneurs.
Among these, 3.8 million are very small businesses which employ 2.4 million people (FTE) and realize 20% of the added value, while 148,000 SMEs employ 3.9 million people and achieve 23% of the added value.
VSEs have 70% of their salaried workforce in tertiary activities. 19% of their employees work in construction against 11% on average; conversely, industry represents only 10% of the workforce of very small businesses, against 25% on average in which there are artisan-type catering activities (bakeries, pastry shops, etc.).
73% have no employee (more than a third of these are self-employed), 13% have one, part-time or full-time, only 14% have more than one employee (in FTE).
SMEs have an average of 26 employees (in FTE); 62% have less than 20 employees and 11% employ at least 50 employees. Construction and traditional industries (textiles, leather, wood, printing, manufacturing of metal products) are more represented than on average (14% and 6% against 11 and 4); scientific and technical activities and administrative and support services are also more present: 18% of the workforce of these SMEs compared to 15 on average, particularly in legal and accounting activities and architectural and engineering activities.
Industrial SMEs have more tangible assets than other SMEs and generally have more resources; their margin rate is among the highest.
The export rate of industrial SMEs is half that of industrial mid-cap companies, while large companies and mid-caps in the manufacturing industry are almost all exporters; only 55% of industrial SMEs are.
 –
–Source : “Companies in France, 2020 edition”, Insee, references collection, read December 2020
Find out more : Business categories – Companies in France | INSEE
–

