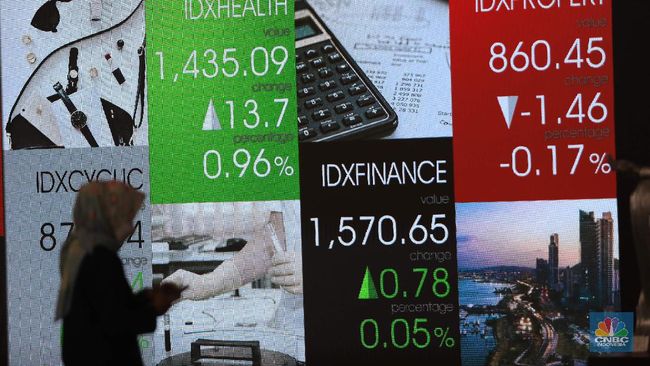
Jakarta, CNBC Indonesia – The Composite Stock Price Index (JCI) weakened 0.59% to 6,562.900 last week, even though market players’ sentiment was good. In 5 trading days, the JCI was actually able to strengthen 3 times. But sharp losses in two trades saw him end up in the red.
When the JCI weakened, the stock market of the United States (US) or Wall Street continued to climb. The S&P 500 index rose 2.28% over the past week, standing at 4,725.79, which was a record closing high in history. Then the Dow Jones index successfully rose 1.65% to 35,950.56, and the Nasdaq rose to lead a gain of 3.19% to 15,653.37.
Wall Street’s strengthening is likely to continue this week which could boost the JCI’s performance. Because there might be a Santa Rally.
Santa Rally is a specific moment, where there is a tendency for Wall Street to increase in the last 5 trading days of each year, and continue in the first 2 days of the new year.
This means that the Santa Rally in the United States will start today, Monday (27/12), and end on January 4, 2022.
The strengthening of the direction of the world stock exchanges will certainly provide positive sentiment to other global stock exchanges, including the JCI. The good news is that in the last 20 years the Santa Rally has made JCI record positive returns for 18 times, only 2 times negative.
The following is the movement of the JCI in the last 20 years during the Santa Rally in the United States (US).
If the Santa Rally lasts for 7 days, the JCI is less. Because domestically, there are more Christmas and New Year holidays than in the United States, where the stock market is usually closed only on December 25 and January 1 only.
In the last 20 years, on average during the Santa Rally in the United States, the JCI recorded a positive performance of 1.65%. The highest increase occurred in 2008 when the JCI shot more than 7.5%.
Meanwhile, negative performance was only recorded in 2002, and in 2017. Last year, during the Covid-19 pandemic, the JCI was also able to record a gain of 0.72%.
At the end of this year, Santa Rally is also expected to return, even when overshadowed by the Omicron variant of the corona virus.
Technically, if you look at the daily chart of the JCI is still below the 50 -day moving average (moving average 50/MA 50), in the range of 6,610 to 6,620 which was previously a strong support.
When the MA 50 was broken and stuck below it, the JCI pressure became quite large.
JCI has also not been separated from the pressure of the Shooting Star pattern on Monday (13/12), which made the pride of the country’s stock market crash the day after.
This pattern previously appeared on Thursday (25/11), after which the JCI slumped for several days.
The Shooting Star pattern is a reversal signal or a reversal of the direction of the price of an asset.
|
Graph: Daily JCI Foto: Refinitiv- – |
The nearest support is now in the range of 6,525. A break below that level will cause the JCI to decline to 6,500.
Meanwhile the chance for a rebound in the JCI can be seen from the Stochastic indicator which has reached the oversold area (oversold).
Stochastic is leading indicator, or indicators that initiate price movements. When Stochastic reaches the territory overbought (above 80) or oversold (below 20), then the price of an instrument has the opportunity to reverse direction.
The target for strengthening the JCI today is to test the MA 50 in the range of 6,610 to 6,620. JCI has the opportunity to continue strengthening if today is able to end trading above the 50 MA.
CNBC INDONESIA RESEARCH TEAM
(pap / pap)
– .

:quality(70)/cloudfront-eu-central-1.images.arcpublishing.com/liberation/P7EDQQRGMJFS3KLBN5A6UBGHAY.jpg)
