Hi traders! Last Friday price BTC was around $ 10,800 and in analysis we talked about the fact that we are almost certainly heading for 11,300 USD and in the case of a lot of bullish market we can also look at 11550-11650 USD, which are levels of extremely strong resistance and from there we could expect a decline.
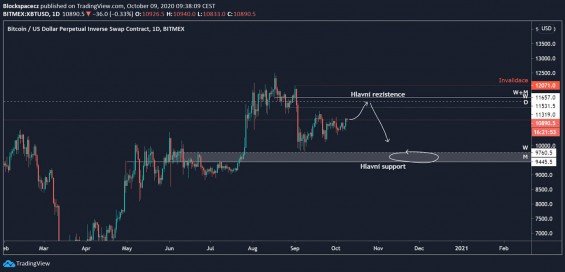
Last week’s script
–
So far, the growth scenario has been beautifully fulfilled and we can see the first downward reflection on the chart.
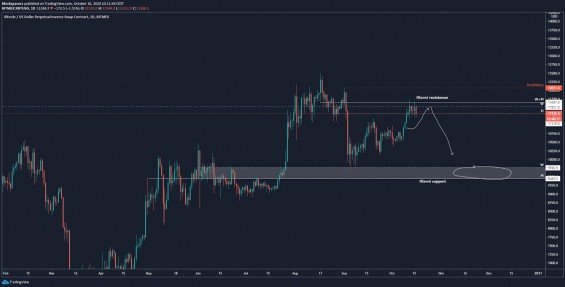

Scenario update from last Friday
–
As you can see, so the macro-scenario continues absolutely beautifully and there is no reason to change anything. Before we get into the analysis of shorter time frames, I want to show once again some of the reasons that lead me to set up this scenario.
Changing market behavior
As you can see in the chart below, after the March price dump, 3 trend waves came up, between which a phase of consolidation has always formed. You can see these marked in gray rectangles.
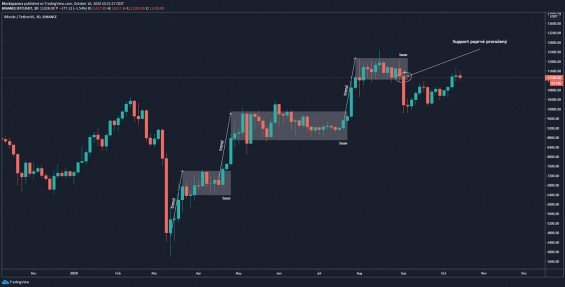

Market behavior since March 2020
–
The previous two have always built one supportwhich then the price only confirmed, but never went under it – and the market therefore, he could remain in the uptrend.
But in the last consolidation, we see a clear change in market behavior – support was pierced here for the first time, which often means that the market has entered either a phase of longer consolidation or a shorter downtrend.
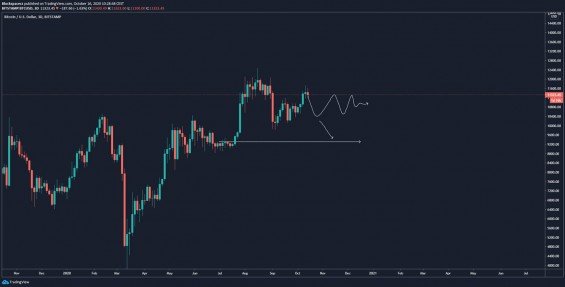

Consolidation and downtrend scenario
–
as you can see, in both cases one can expect a way down from the current levels.
Resistance testing
We talked about this in the previous article – we expected a trip up to $ 11,300, or $ 11,550 – $ 11,650 precisely because there are untested resistances from higher time frames.
The most important is the level of 11,655 USD, where resistance converges on a weekly and monthly time frame. If the price exceeded this level, it would mean a transition to the uptrend and the invalidation of our bearish scenario.
So far, however, we do not see anything like that – on the contrary – the price reached this level on Monday and bounced down from it.
If this downtrend is confirmed, then after testing the resistance of higher time frames, the market can test the supports on the same timeframes (ie weekly and monthly chart). And the nearest untested levels are just $ 9,750 and $ 9,450.
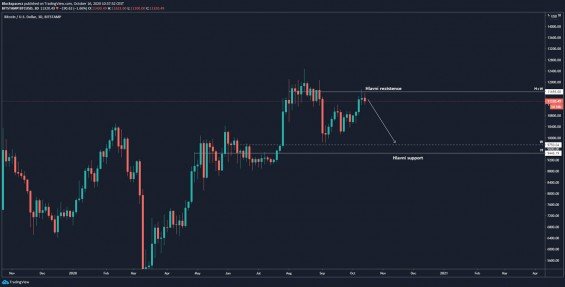

The whole scenario for the development of the BTC price
–
Trend to lower time. frameworks
In the chart below, we see that Bitcoin has been building a range between two daily levels for about a week ($ 11,319 and $ 11,528). During Monday, the deviation from the range came up – just to test the HTF level around the price of 11,650 USD. Then the price immediately returned to the range.
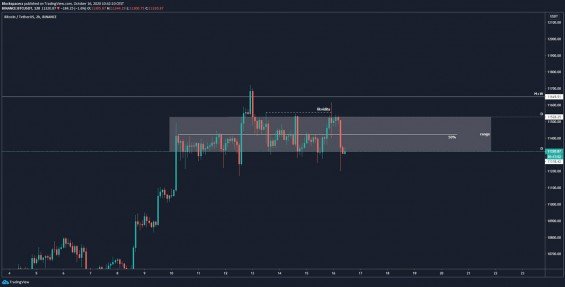

Range on 2h graph BTC / USD
–
Another minor deviation from the range took place yesterday, when the market pumped up to $ 11,617, picking up the last liquidity (stoplossy) of shorts above previous highs. And again the way down followed.
This is exactly what it looks like distribution – At this stage, however, the conditions are already met for us to go straight down.
For the bearish scenario, I would like to see a drop either straight or pullback to a maximum of 50% range (price 11430 USD).
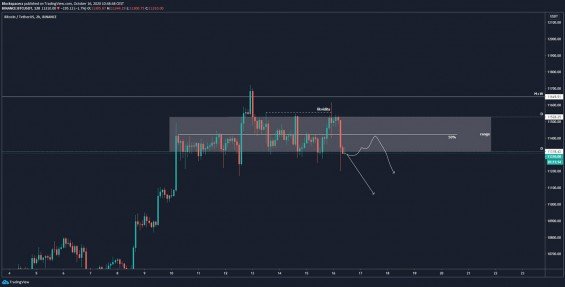

Current short-term scenarios of BTC price development
–
If we look at the resistance levels on the way down, I am personally most interested in the following supports:
- 10 906 – 10 840 USD
- 10 450 USD
- 10 150 USD
- 9 750 USD
- 9 450 USD
I marked them on the chart below:
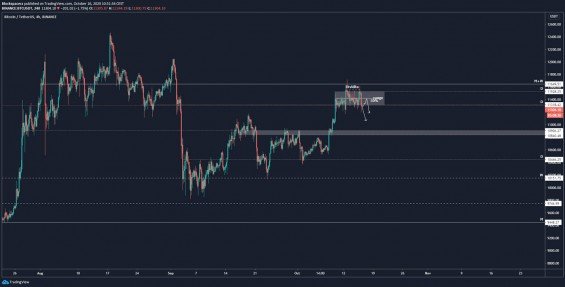

Important BTC price supports that I am watching now
–
Conclusion on today’s analysis
Bitcoin is currently running exactly according to our scenario set back a few weeks. The next big move should be downwards, but it will depend on the response to support in the current rank. To follow the scenario, the price should not go higher than $ 11,430 now.
The first important supports for selecting profits from short positions are then around 10,900 USD.
![[Bitcoin] Analysis 16. 10. 2020 [Bitcoin] Analysis 16. 10. 2020](https://cdn.finex.cz/wp-content/uploads/2020/10/cena-bitcoinu-analyza-16-10-2020.jpg)
