Jakarta, CNBC Indonesia – The Jakarta Composite Index (JCI) was down 0.11 percent to 6,428,315 in Wednesday’s trading. Trade data shows that foreign investors are taking net buying (net buy) nearly Rp. 400 billion in the regular market, with a transaction value of Rp. 28.2 trillion.
This correction is fairly reasonable considering that since the beginning of the year the JCI has shot more than 7%. Moreover, the JCI has been at its highest level since July 2019, meaning that it has recovered far back to the level before the corona virus disease (Covid-19) pandemic hit.
In today’s trade, Friday (15/1/2021) JCI has the opportunity to strengthen again, because there is good news from the United States (US). President-elect Joseph ‘Joe’ Biden announced Thursday that he will launch a fiscal stimulus package worth US $ 1.9 trillion.
The US $ 2 trillion US $ 2 trillion fiscal stimulus that was released in March 2020 was one of the keys to the rise of the US stock market from its downturn. The rise of the US stock market also boosted other stock exchanges, including the JCI.
So that the stimulus this time also has the potential to have the same effect.
Technically, there is no change in the levels that must be considered compared to yesterday’s analysis.
The JCI movement on Tuesday and Wednesday formed a Doji pattern. A price is said to be forming a Doji pattern when the trade opening and closing levels are the same or nearly exactly the same.
Psychologically, the Doji pattern shows market participants are still hesitant to determine the direction of the market whether to strengthen or weaken.
|
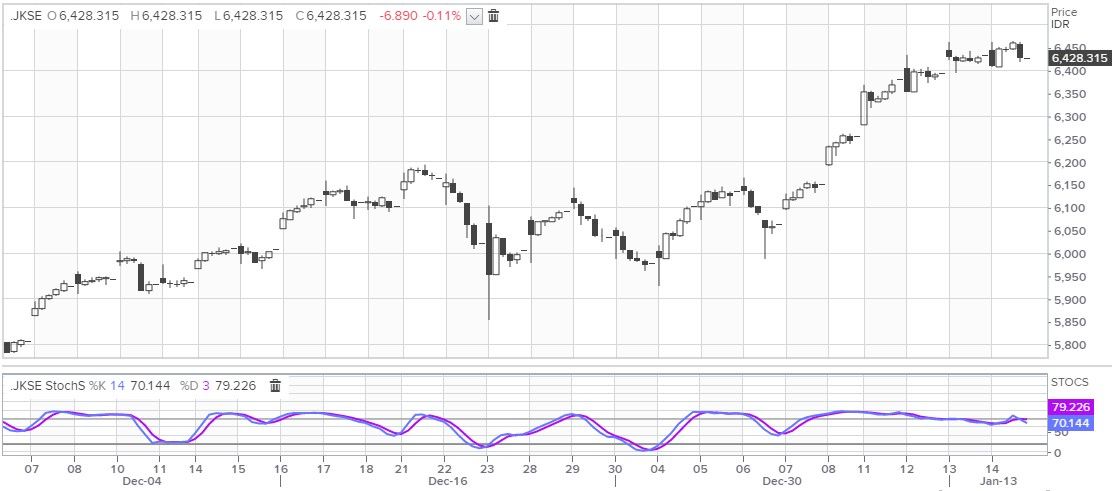
Graphic: Daily IHSG Foto: Refinitiv- – |
JCI is still moving above the 50-day moving average (moving average/ MA 50), 100 days (MA 100), and 200 days (MA 200), which are the capital to recover in the long run.
The stochastic indicator on the daily chart is now entering the buy saturated region (overbought).
Stochastic is leading indicator, or indicators that initiate price movements. When Stochastic reaches the territory overbought (above 80) or oversold (below 20), then the price of an instrument has the opportunity to reverse direction.
 Graph: IHSG 1 Hour Graph: IHSG 1 HourFoto: Refinitiv – – |
Meanwhile on the hourly chart the stochastic is starting to exit the territory overbought, so the risk of JCI correction is quite large.
Initial resistance is in the range of 6,450, if JCI is broken, there is a chance to go to 6,500, even if it is broken, the possibility is even higher.
Meanwhile, if stuck below the 6,450 resistance, JCI is at risk of continuing the correction. Immediate support is in the range of 6,400 to 6,390, if the JCI is broken there is a risk of falling towards 6,365. The next support is around 6,330.
CNBC INDONESIA RESEARCH TEAM
(pap / pap)
– .


