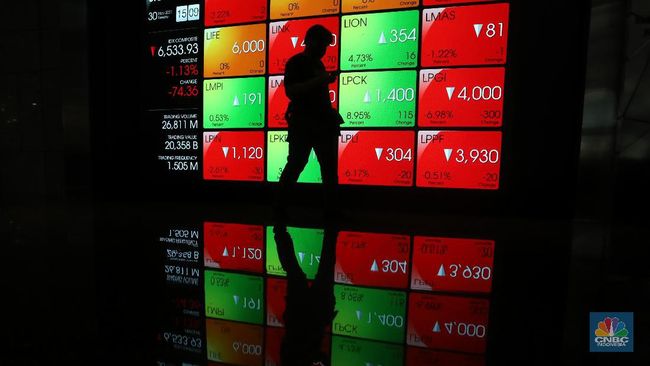
Jakarta, CNBC Indonesia – The Composite Stock Price Index (JCI) closed up 0.17% at the level of 6,658.36 on Thursday (13/1/2022). For today’s trading, Friday (14/1) there are several sentiments that deserve attention.
First from Wall Street, the New York stock exchange had to feel bad luck again. Its three benchmark stock indexes had to close with sharp corrections.
The Dow Jones Industrial Index fell 0.49%. The performance of the S&P 500 and Nasdaq Composite indexes was even more disappointing. The two indices fell more than 1% and 2.5% respectively this morning.
The significant weakening that occurred in the New York stock exchange would certainly be a negative sentiment for the domestic stock market today.
The second is the trend inflow continuing foreign funds in RI’s equity assets. In the stock market, foreign investors have recorded net buying (net buy) of Rp 3.37 trillion in the last week.
Even though there are inflow In the stock market, the performance of the Composite Stock Price Index (JCI) only rose slightly by 0.08% in the past week. Foreign net buy Rp 587.9 billion in all markets yesterday.
The third is the release of economic data from Bank Indonesia (BI) in the form of the Prompt Manufacturing Index and the Survey of Business Activities.
However, this data is not expected to have a significant contribution in moving financial markets considering the current main focus is more on the movement of global financial assets amid the US central bank’s plan to tighten monetary policy.
In addition to the three factors above, investors and market participants need to pay close attention to market psychological factors as reflected in technical indicators. Here’s the review.
Technical Analysis
|
Photo: Son Technical- – |
Movement of the JCI using the daily period (daily) of the Boillinger Band (BB) indicator via the upper limit area method (resistance) and the lower limit (support).
If you look at the closing position, JCI needs to penetrate support closest at 6616 and further at 6.511 to form a downtrend (bearish). Meanwhile, to form an upward trend, JCI needs to break the resistance level at 6,721.
The Relative Strength Index (RSI) indicator is a momentum indicator that compares the amount of the latest price increase and decrease in a period of time and serves to detect overbought conditions (overbought) above the 70-80 level and oversold (oversold) below the 30-20 level. Currently the RSI is in the 54.60 area.
When using another technical indicator that is the Moving Average Convergence Divergence (MACD), the EMA 12 line is still above the EMA 26 line and begins to form a convergent or narrowing pattern.
On the other hand, the MACD indicator histogram bar tends to fall. This also confirms that the JCI has a chance to be corrected in today’s trading.
The index needs to pass (break) one of the levels resistance or support, to see the direction of further movement.
CNBC INDONESIA RESEARCH TEAM
(trp/vap)
– .


