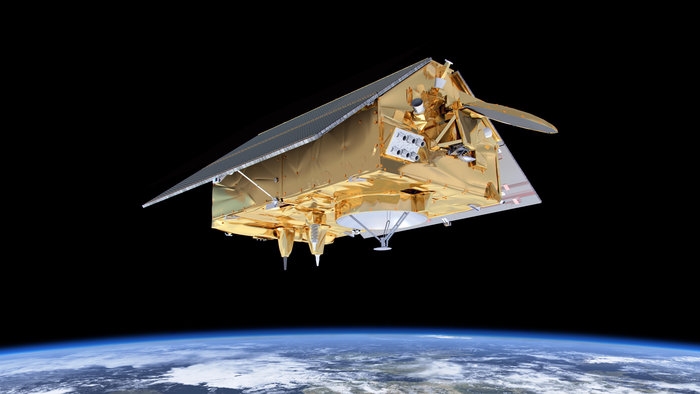
Michael Freilich’s Sentinel-6 is the latest in a 30-year chain of missions whose sea-level data scientists can use to compare this year’s El Niño phenomenon to past ones. Not every El Niño occurs exactly the same. Their effects can also differ significantly. The US-European Sentinel-6 satellite Michael Freilich is helping to estimate these impacts on a global scale by monitoring changes in sea level height in the Pacific Ocean. Water expands when heated, so areas with warm water tend to have a higher level. El Niño is characterized by above-average sea level heights and above-average temperatures of the Pacific Ocean around the equator. These conditions may extend poleward along the west coast of North and South America. El Niño then brings wet weather to the American Midwest and, conversely, dryness to locations in the western Pacific, including Indonesia. This year’s El Niño is still taking shape, but scientists can already compare its development with recent years.
In the past thirty years, there have been two extreme El Niños – the first between 1997 and 1998 and the second between 2015 and 2016. In both cases, there were shifts in the global temperatures of air and water masses, wind and precipitation, and sea level. The attached map shows the height of sea levels in the Pacific at the beginning of October in the years 1997, 2015 and 2023. The above-average high level is shown in red and white, the below-average height is shown in blue and purple. Sentinel-6 Michael Freilich recorded the data in 2023, the 1997 data comes from the TOPEX/Poseidon satellite, and the 2015 map was produced by the Jason-2 satellite.
Data from three satellites compare the height of the levels in the Pacific Ocean in 1997, 2015 (in both cases a strong El Niño occurred) with the year 2023. This year’s development is not nearly as intense.
Source:
Between 1997 and 2015, sea levels in large areas of the central and eastern Pacific rose by more than 18 centimeters above normal. This year, they are raised by only 5-8 centimeters compared to the average and, moreover, over a smaller area than in 1997 and 2015. Both of the aforementioned extreme periods of the El Niño phenomenon reached their peak in late November and early December, so this year’s El Niño may still get stronger. “Every El Niño is a little different,” admits Josh Willis, a scientist at the Jet Propulsion Laboratory in Southern California involved in the Sentinel-6 mission Michael Freilich, adding: “Compared to the big events, this winter seems modest, but it could still give us a wet winter in the US Southwest if conditions are right.“
Image Sources:
https://earth.esa.int/…b1bb-c9d53daebb85?t=1539171436000
wp-content/uploads/2023/10/1-pia26099-s6mf-elnino-oct.gif
Contact the author: report errors, inaccuracies, comments
2023-10-22 16:28:37
#formation #Niño #satellite #perspective


