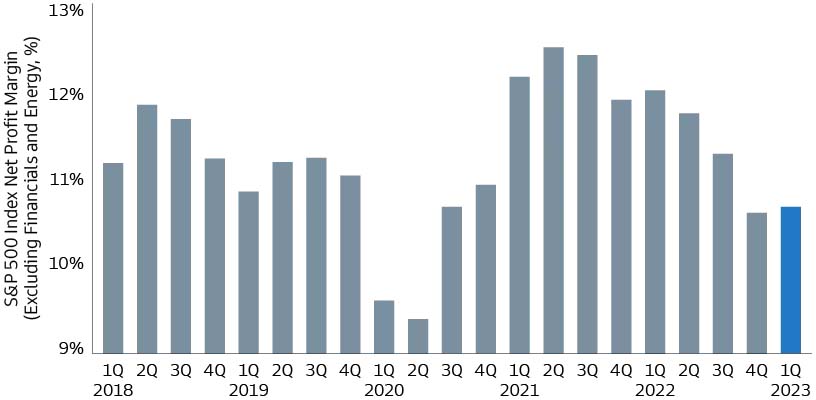
GSAM chart of the week. The results of the broad index of the New York Stock Exchange were better than expected in the first quarter.
The S&P 500 Index’s results were better than expected in the first quarter, with sales and earnings beating consensus forecasts. The level of expected profit margins increased in 9 of 11 sectors, reflecting the first sequential increase in margins in over a year, and is now back to pre-COVID levels. Slowing economic growth remains a risk to margins, although we believe resilient earnings and slowing input cost inflation will support earnings in the coming quarters.
Our chart of the week shows quarterly net profit margins for the S&P 500 index, excluding financials and energy.
S&P 500 Index Net Profit Margin (excluding financial and energy sectors, %)

Source: Compustat, FactSet et Goldman Sachs Asset Management.
2023-05-26 05:00:00
#expected


