Bitcoin (BTC) was so merciful that it generated another quite crucial signal announcing that it was about to retracement. But it is only a signal, so if the market environment changes radically due to a bad event, everything can get quite complicated again.
But if nothing changes, bitcoin really has a chance to grow much higher than we do now. The fall was generally threatening. And after threatening falls, aggressive and considerable retracement commonly occurs. It’s always been that way, so I don’t see why it shouldn’t be now. In other words, we are certainly not in a bias and do not follow the “wish of the father of thought”. We have countless technical arguments for reflection.
Current situation on 3D BTC / USD
Today we will exceptionally look at a three-day chart (3D). This is a time frame that I follow very little, but when there are some dynamic periods, it is better to look at it from time to time. It is not enough to watch only 1D and 1W, when the market is maximally dynamic. Respectively, there is a big gap between a week and one day. Therefore, it is very likely that we will address this time frame more often.
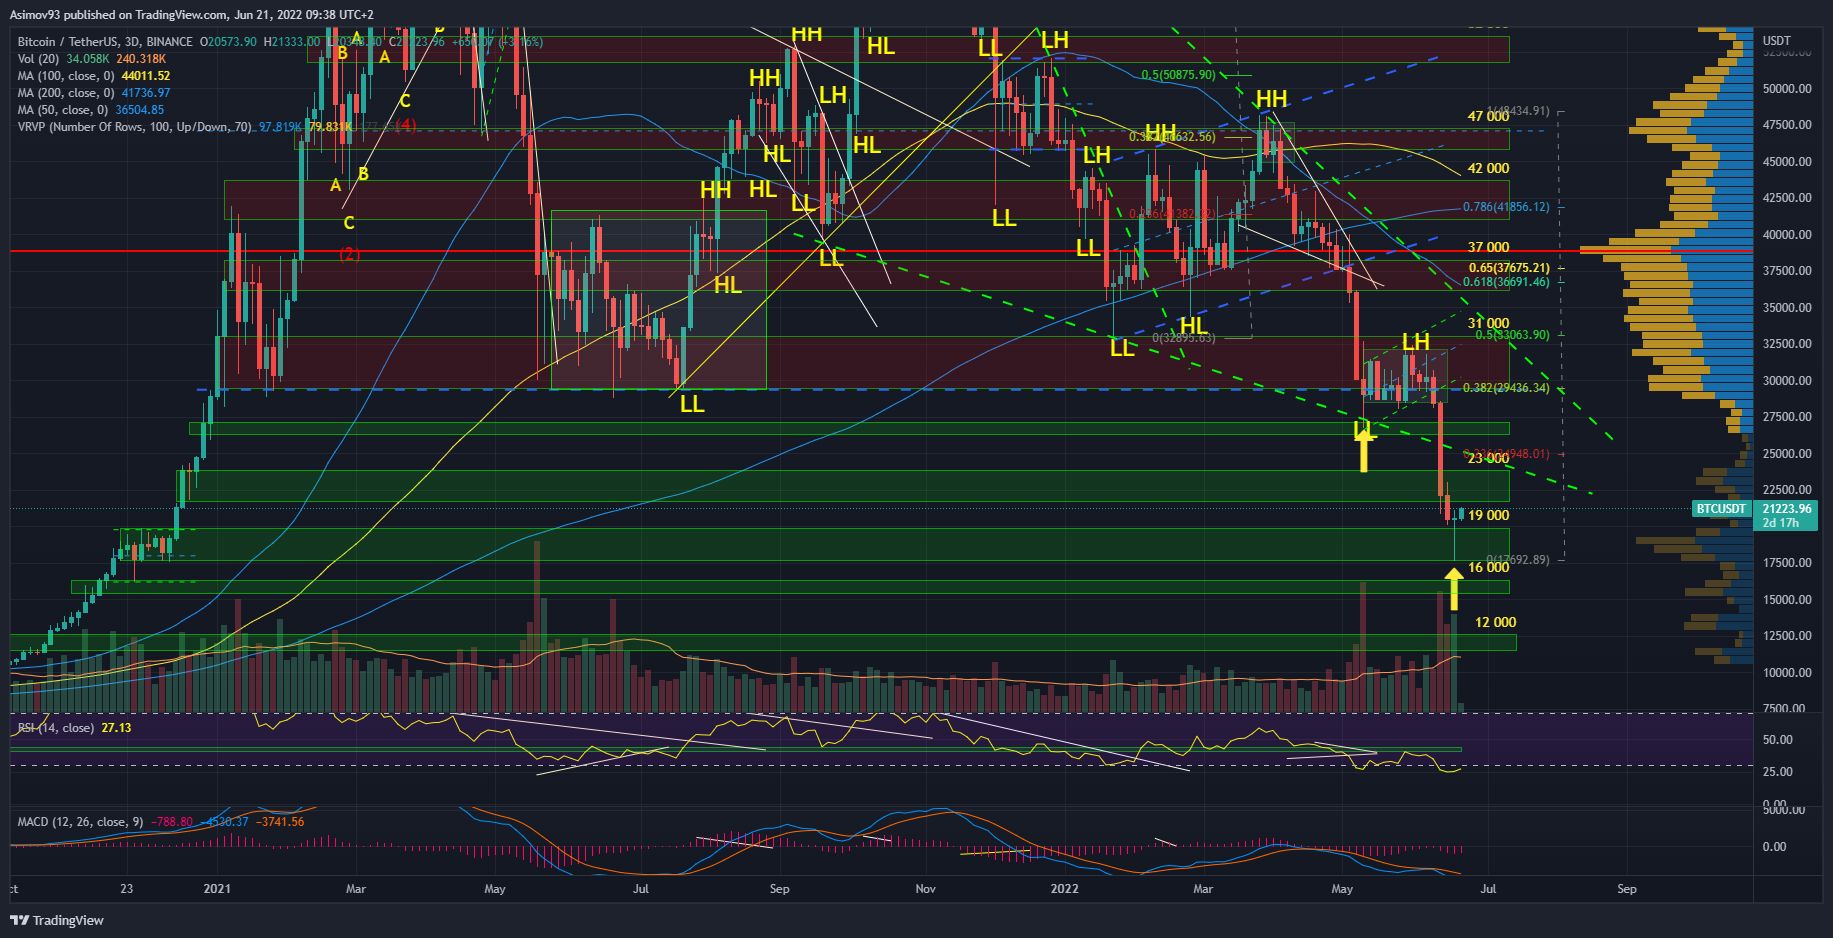
In any case, Bitcoin created a bottom in 3D in the form of a candle Doji. A to se decent volumes. This is exactly something we have been missing for a long time. We just needed a candle on a higher time frame, which looks exactly like this. And we got it, which is a huge signal for us.
To interpret this correctly, he fully tested bitcoin S/R band, which is in the range of 20,000 – 17,500 USD. And in this band, the supply was completely absorbed. We know this from the long bottom wick and close over 20,000 USD. The bulls are now waiting to respond.
Purely textbook, it still needs confirmation in the form of another three-day close over the close of the previous candle. But at the moment I don’t see any problem in considering it relevant enough.
Where can the course climb anyway? In this case, it is reasonable to start from Fibonacci levels. The first level is 23,6 %, which is a price level of about $ 25,000. The next Fibo level is 38,2 % on near the S / R band around $ 31,000. And I would venture to say that the bitcoin band cannot break through. Respectively for bears, it will be an ideal area for their shorts. In general, bitcoin should be able to smear at least 38.2% of the falling wave that has been going on since the end of March.
Current situation at 1D BTC / USD
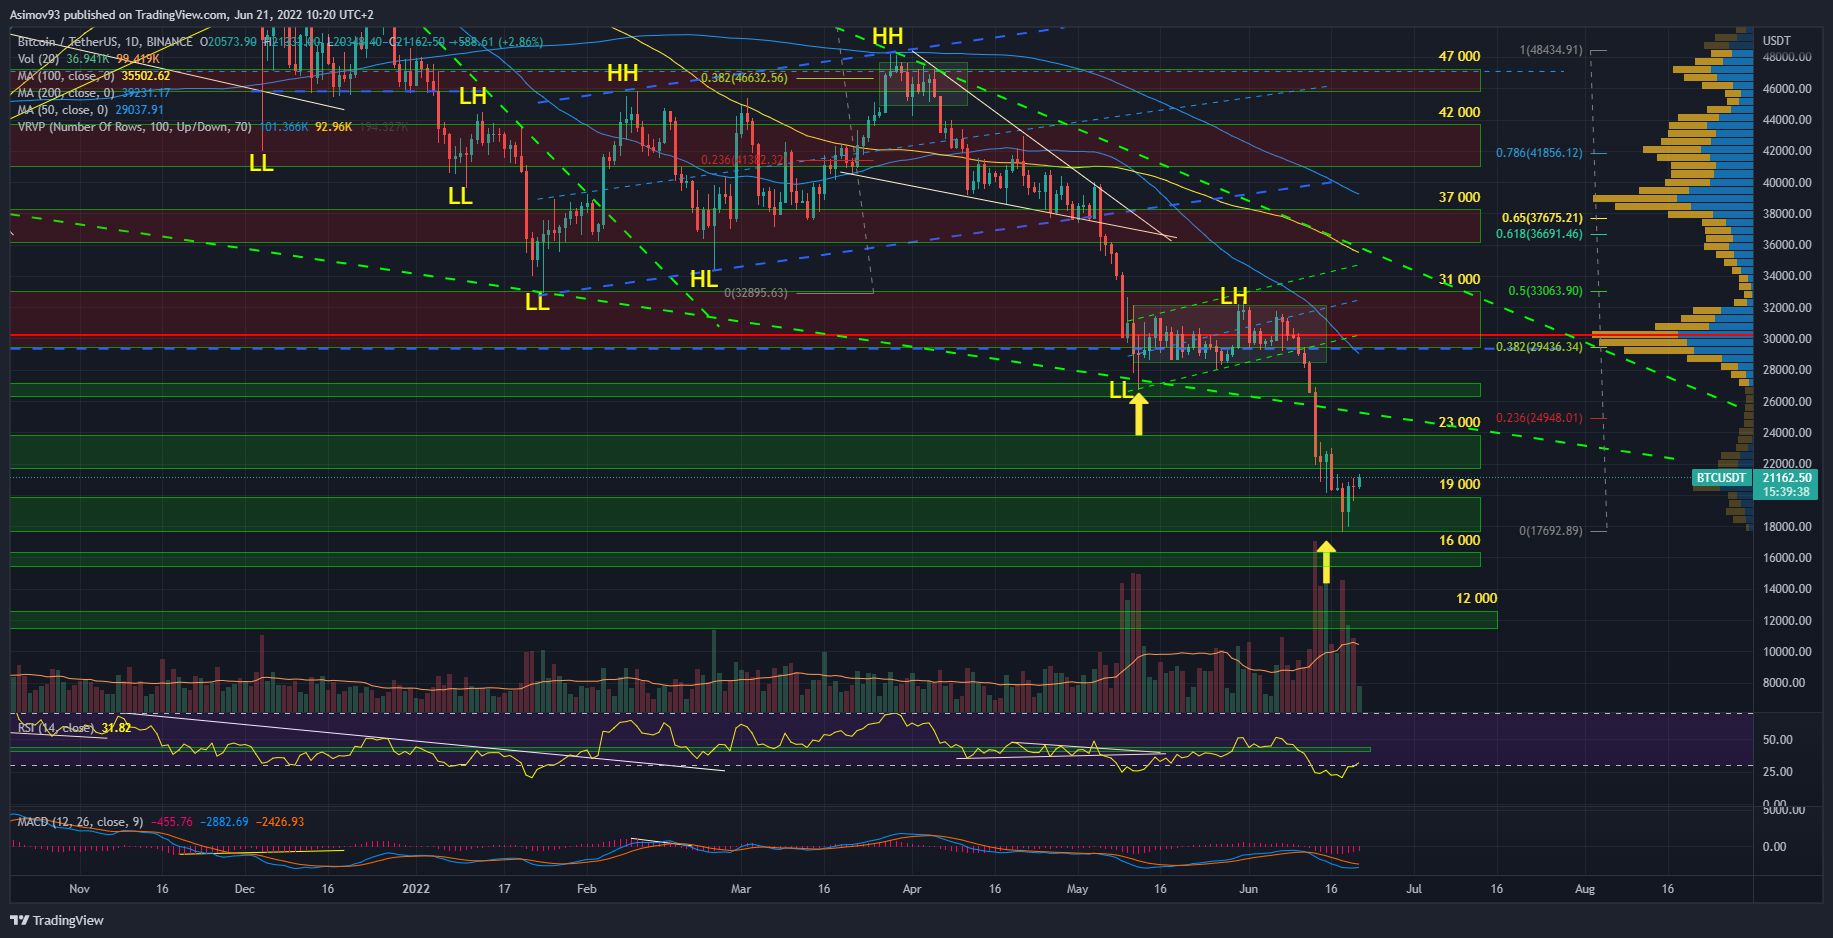
For completeness, I also attach a daily chart, where Sunday’s candle already looked quite good. Respectively, it had a green form with solid volumes. And most importantly, she completely covered Saturday’s red candle. I have the impression that this candle pattern is called Tweezer bottom. Respectively, it is turnover pattern. Sunday candles have smaller volumes, but it’s not such a drastic difference.
Otherwise according to volume profile we have a significant sharpness just around the $ 31,000 resistance band. There will be many bears literally shorted for life. Respectively, this is the first S / R band where the potential risk / benefit ratio is advantageous for bears. Semi-pathetically, at that level, selling pressure will be strongest.
Indicators
Daily RSI indicator it returns to us after more than a week above the limit of 30 points. Which can certainly be considered a bull signal as well.
In conclusion
I would say that over the last few days, the market situation is gradually improving. Bitcoin certainly has a great chance to break through the levels that it previously broke so easily during the decline. So it shouldn’t be a big deal to go back to at least $ 31,000.
How long can it take? I honestly don’t expect longer growth until the end of July. Although the spring was quite compressed during those deep drops and the offer was significantly exhausted. But I’m very skeptical that we’re going back to that wide trading range of between $ 30,000 and $ 65,000.
If you have any question regarding cryptocurrencies, feel free to add to our newsgroups on Facebook. Don’t forget to join ours as well official discord server KRYPTOMAGAZIN CZ.
ATTENTION: No data in the article is an investment board. The analysis does not try to predict future price developments. It serves exclusively as educational content on how to approach the market mentally. Before you invest, do your own research and analysis, you always trade only at your own risk. The kryptomagazin.cz team strongly recommends individual risk considerations!
–


