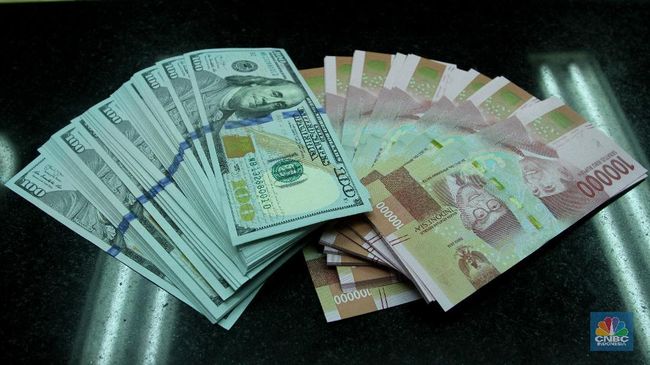
Jakarta, CNBC Indonesia – The sentiment of market participants was quite good early last week, making the rupiah slightly strengthened 0.08% against the United States (US) dollar to Rp. 14,353/US$.
In today’s trading, Tuesday (5/4/2022), the movement of the rupiah will likely remain the same, only slightly. This is because the US dollar is at its strongest, which makes it difficult for the rupiah to strengthen sharply.
The improving sentiment of market players is evident from the strengthening of the majority of Asian stock markets, which then continued to Europe to the United States (Wall Street) in trading early last week.
The Composite Stock Price Index (JCI) was also able to gain 0.53% to 7,116,218, becoming an all-time high. Foreign investors are again buying up shares in the country. Yesterday’s transaction value reached around Rp. 11.5 trillion.
As of yesterday, foreign investors still recorded a net purchase of IDR 553.77 billion in all markets, with details of IDR 394.69 billion in the regular market and IDR 159.07 billion in the cash market and negotiations. Throughout this year, foreign investors recorded a net purchase of Rp 33.76 trillion.
The flow of capital to the Indonesian stock market is one of the keys for the rupiah to remain quite stable, even though the US dollar is still strong. The US dollar index has recorded a 3rd straight day of strengthening of more than 1.2% and on Monday trading touched the level of 99.
Technically, there has been no change in levels that must be considered considering that the rupiah, which is symbolized by USD/IDR, only strengthened slightly. Rupiah is still above the 50-day moving average (Moving Average 50/MA 50) 100 and 200.
The three MAs move horizontally, which is an indication that the rupiah is moving sidewaysespecially since the beginning of the year forming a Rectangle pattern.
The lower limit of the Rectangle pattern is around Rp. 14,240/US$ and the upper limit is around Rp. 14,400/US$. To see where the rupiah is going in the medium term, one of these levels must be broken.
|
Chart: Daily Rupiah (USD/IDR) Foto: Refinitiv- – |
The Stochastic indicator on the daily chart is moving up and starting to enter the territory overbought.
Stochastic is leading indicator, or indicators that initiate price movements. When Stochastic reaches the territory overbought (above 80) or oversold (below 20), then the price of an instrument has the opportunity to reverse direction.
Stochastic on the hourly chart has started to break out of the overbought area.
 Chart: Rupiah (USD/IDR) 1 Hour Chart: Rupiah (USD/IDR) 1 HourFoto: Refinitiv- – |
The closest resistance is around Rp. 14,370/US$, if penetrated, the rupiah risks weakening to Rp. 14,400/US$, which is the upper limit of the rectangle pattern.
Meanwhile, as long as it stays below resistance, the rupiah has the opportunity to strengthen to Rp. 14,340/US$ to Rp. 14,320/US$.
CNBC INDONESIA RESEARCH TEAM
(pap/pap)
–


/data/photo/2022/04/05/624b88d884209.jpg)