Input 2021.01.07 10:59 | Revision 2021.01.07 11:24
On the 7th, the land building big data platform Value Map revealed this in the ‘2020 Land Market Trend Trends’ report, which analyzed 700 million accumulated usage data of the company’s website and app users (6 million annually).
Hwaseong-si, Gyeonggi-do, where land search and actual transaction prices were most frequently confirmed on the value map last year, rose one notch from the second place last year. In the case of Hwaseong, it seems that interest has increased in that investment plans of major companies were announced, various development projects, etc., and the area is wide and there are many lands.
△2nd place is Pyeongtaek, Gyeonggi △3rd, Anseong, Gyeonggi △4th Sejong City △5th Jeju City △6th Asan, Chungnam △7th Suncheon, Jeonnam △8th place Yangpyeong-gun, Gyeonggi △9th place Cheoin-gu, Gyeonggi-do △10th Ulsan Ulju-gun.
–
–
On the other hand, in the case of Cheoin-gu, Yongin-si, after the boom in the semiconductor cluster of SK Hynix, the rankings declined compared to the previous year, and the interest in Seogwipo-si, Jeju-si also fell sharply as the Jeju investment fever subsided.
The region where the search volume increased the most compared to the previous year was Gyeongbuk Gunwi County. Search volume in this area increased by 84.7% over the previous year. As the issue of Daegu-Gyeongbuk new airports and the incorporation of the Gunwi Army into Daegu City continued for a year, interest seems to have increased. The amount of search for land in the Chungcheong area has also increased, reflecting interest in the issue of capital relocation and regional development plans.
People’s online use and search data is becoming big data that gauges trends in the real estate market and future valuation. Value Map plans to supply key indicators that can be used in the land and other real estate data markets, which were insufficient compared to residential facilities such as apartments, using search big data.
The actual transaction price data takes at least a month or more from transaction to report, while real-time analysis of search trends can be used as a leading indicator of the market. In addition, since the search data is far greater than the reported amount of actual transactions, it is possible to recognize changes in real estate not only in metropolitan units, but also in eup/myeon or dong/ri units.
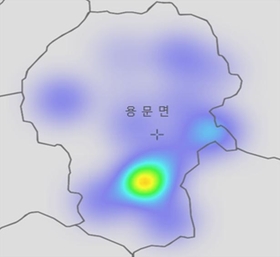
For example, in the case of Yangpyeong, which ranked 8th in search trend and 4th in search trend increase/decrease rate, if’Seojongmyeon’ continued to be ranked at the top of each town and village, it ranked first overall, but looking at the monthly increase, 2019 Since the second half of the year, the search volume for’Yongmun-myeon’ has increased significantly. In the case of’Damun-ri’, when the Yangpyeong Damun district development plan was approved in September 2019, the number of searches increased.Afterwards, the sale of apartment complexes in February last year, and then expanded to regulated areas, leading to a sharp increase in interest in non-regulated areas and year-end sales.
Lee Chang-dong, head of Value Map Research Team, said, “With Value Map search data, we are able to analyze the trends of the land market in real time, which has not been possible,” he said. “Big data of the land and business commercial real estate market, which had less information compared to the apartment market, “We will help build a faster and more transparent trading market.”
–
– .


