
Bitcoin (BTC) has a weekly close, so in today’s analysis we will naturally focus on the weekly chart. As I said in yesterday’s video analysis, the bulls had the last few hours to change the shape of the weekly candle, which was very bearish at the time. They only succeeded in part, but we will explain everything in more detail in the text below.
Current situation at 1W BTC / USD
There was practically nothing on the market on Saturday, but Sunday was really dynamic for Bitcoin. There is not much dynamics on the weekends, so I took the morning form of Sunday candle almost as definitive. Around noon, however, the price was pumped by a few percent, which was enough to wipe out some of the devaluation. This growth was enough to improve the appearance of the candle.
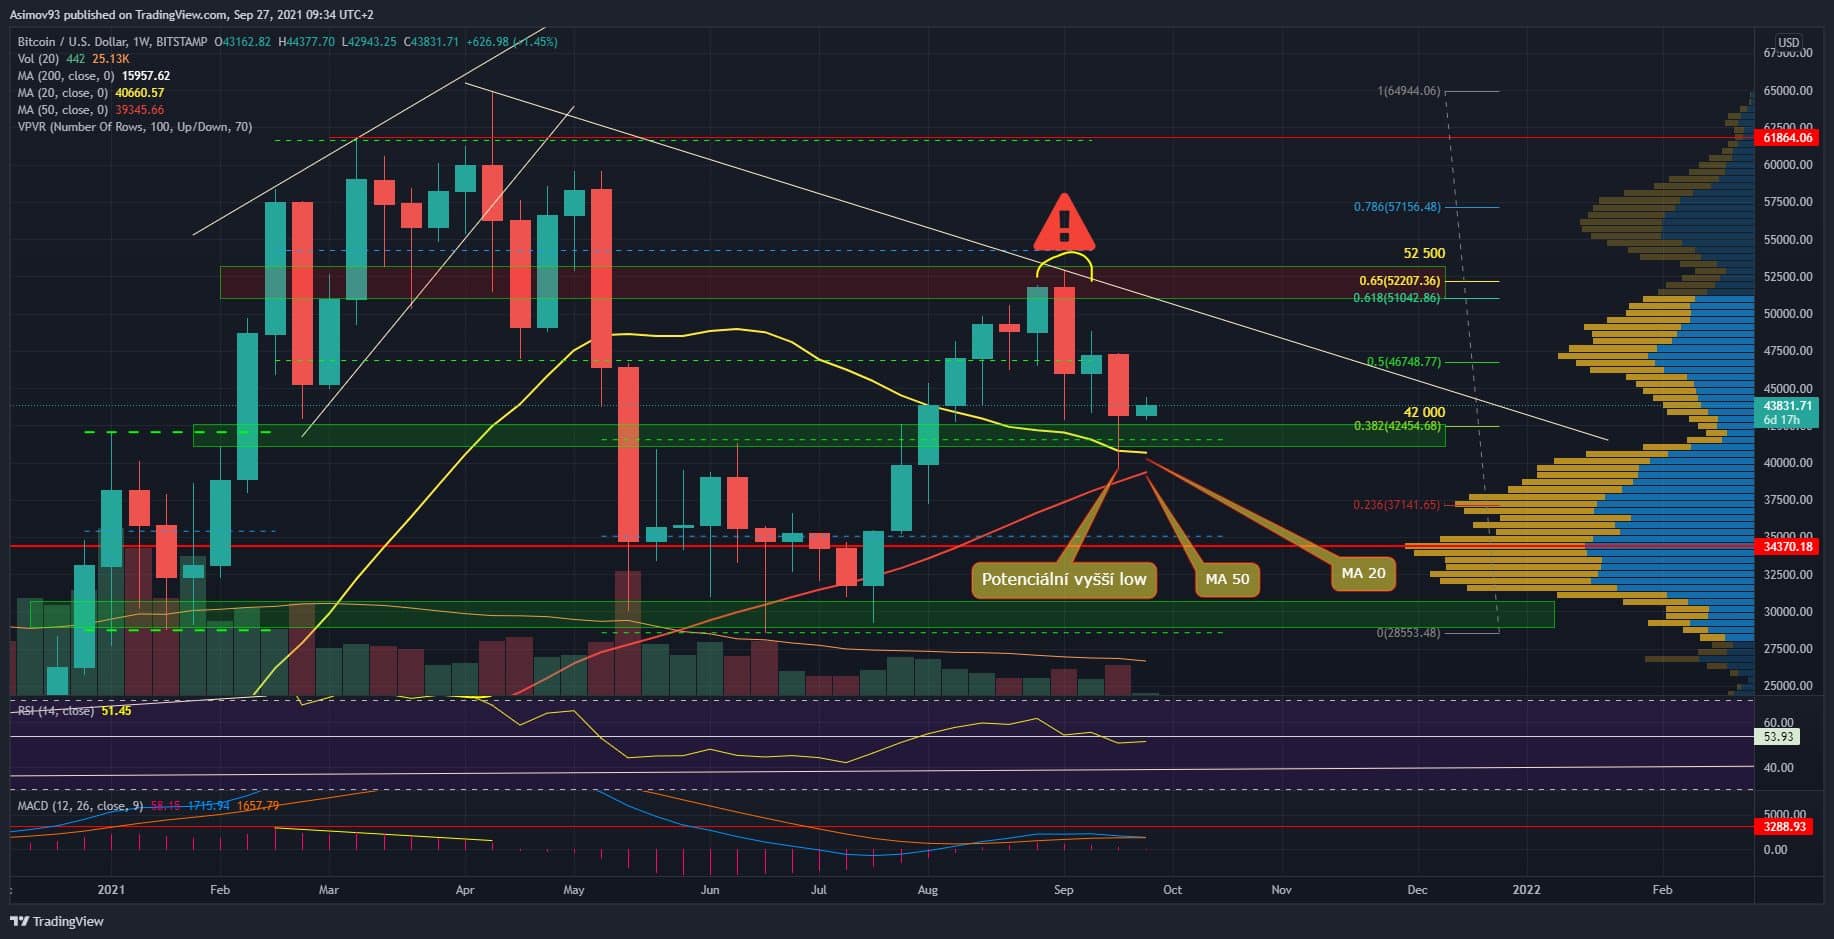
Even so, the appearance of the freshly closed weekly candle is more of a neutral nature. One might argue that it is more bearish because the wick is shorter than the body. This means that last year the bears still won in the last week. But the truth is that we must also perceive the context. We have a clear reflection from supportní confluence, which consists of the Low Volume Node volume profile, MA 50, MA 20 and price level.
As I have pointed out a few times, the entire price range in the range of approximately 41,000 – 31,000 USD is one big one on the BTC market cluster. That is, a massive wall composed of a large number of potential shoppers. In addition, the cluster is clearly much larger than the two, which are at higher price levels.
Therefore, there is a good chance that Bitcoin created on the weekly chart higher low. In previous analyzes, I pointed out that this is what Bitcoin needs. Easily recognizable uptrend structure on a weekly time frame. Logically, we are not sure that last week’s low is final. But in context, there is a good chance that we have obtained it. I would like to point out, however, that according to the daily chart, a drop to around USD 37,000 would still make sense.
In terms of volumes, they were the largest in about six weeks. That players who left during the summer holidays would finally return to the market? The more volumes, the better.
Indicators
The weekly RSI is still in the upper half of the values, which is positive. However, the MACD indicator is approaching a bearish cross. This is a huge problem, because a substantial part of the participants speculated on the recent bullish cross. If this bullish signal is soon canceled, it could cause an avalanche of sales.
In conclusion
It looks promising for Bitcoin and a lot of participants will definitely speculate on a higher low. After all, they have a strong supportive confluence in their backs. However, it is important to realize that sellers are still on horseback, so there is still a potential risk in the market. Everyone has to think rationally about the market and decide accordingly.
ATTENTION: No data in the article is an investment board. The analysis does not try to predict future price developments. It serves exclusively as an educational text on how to approach the market mentally. Before you invest, do your own research and analysis, you always trade only at your own risk. The kryptomagazin.cz team strongly recommends individual risk considerations!
–

")