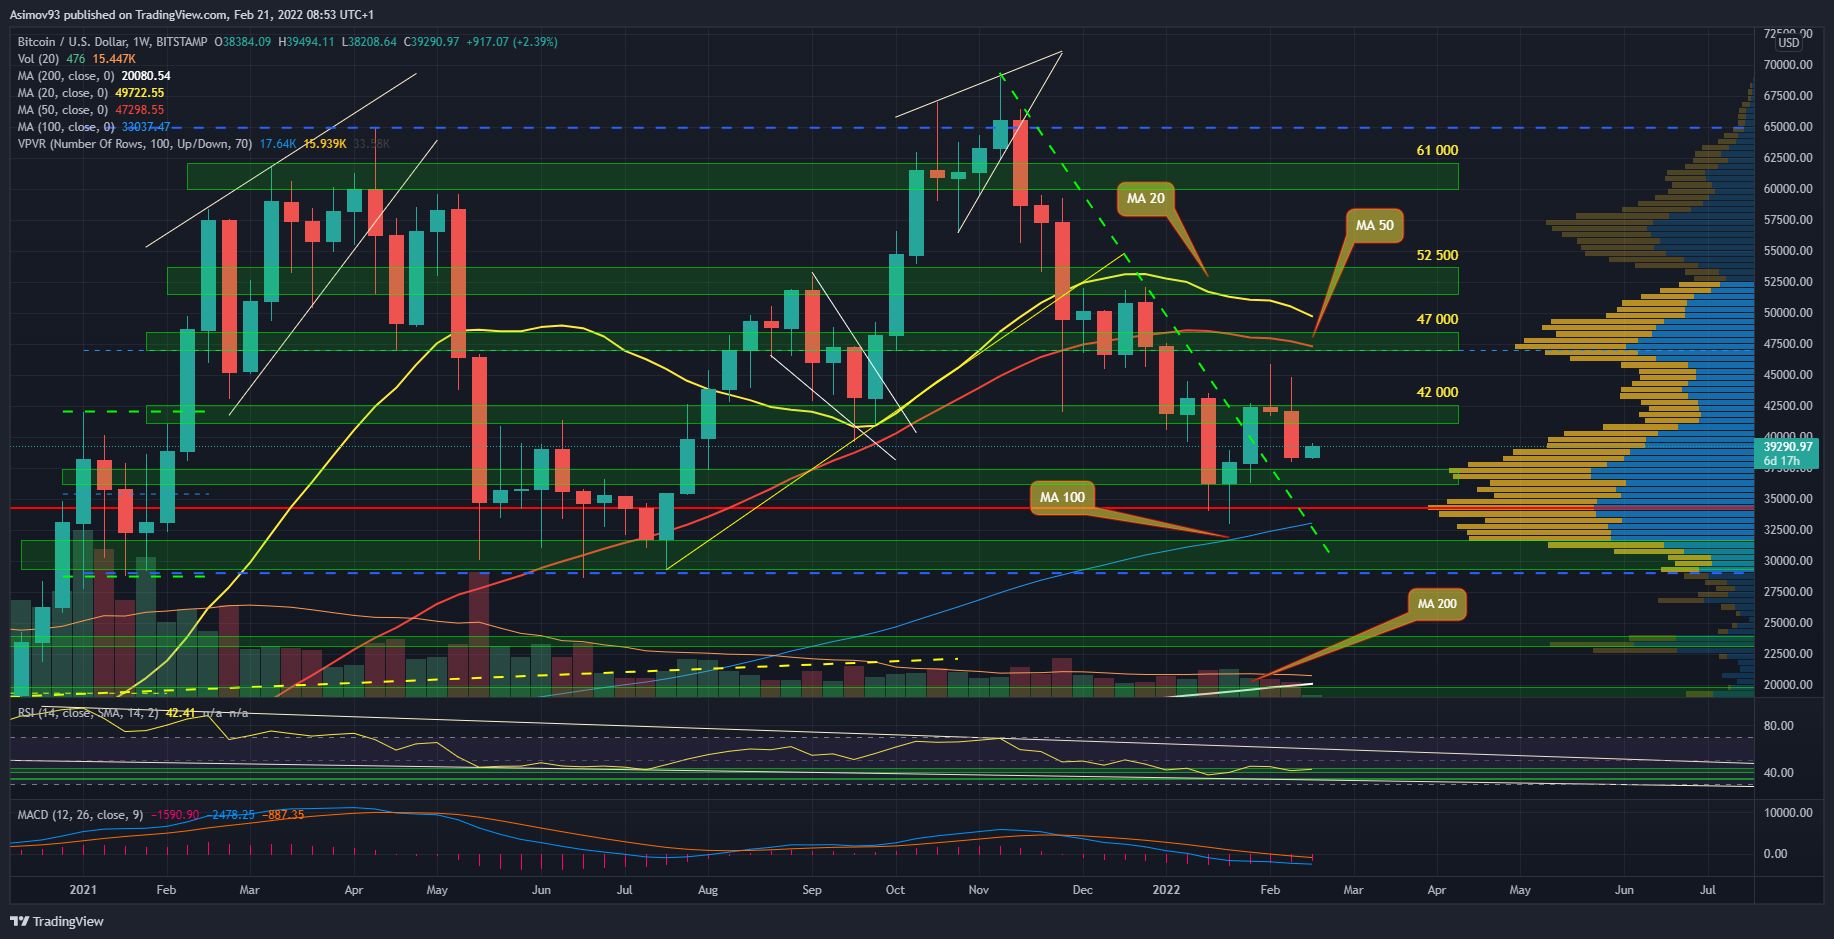
Bitcoin (BTC) ended last week, so we learned a few important things. Respectively, the market clearly indicates to us where the next exchange rate development is likely to go. Of course, we don’t have a crystal ball to be 100% sure. The market situation is not static and can sometimes develop very dynamically.
Current situation at 1W BTC / USD
I have been criticizing the market for a relatively long time for not being suited to the price development from the turn of January / February. The market was practically flowing point of control volume profile and immediately went upstairs. Without any consolidation, ie without the possibility to accumulate. That’s why I was very skeptical about the price increase that lasted about two weeks.
When bitcoin got beaten last week and the then weekly candles closed in very dismissive form, I was not too surprised. However, it wanted some confirmation, which came very soon. The last weekly candle logically has a truly bearish appearance and is confirmatory. The interpretation is therefore quite simple.
First we have to make it clear that the candle is a breakthrough because it broke S/R level 42,000 USD. Among other things, we have a close below this level, which in itself is another signal to decline. There is also a close pod close of the previous weekly candle. That is, the rejection, if you want a signal to turn, is also confirmed.
I must emphasize that overcoming $ 42,000 and pushing the exchange rate back below this level is typical bull trap. Price developments from the last few weeks tell us that there is something wrong with the market. What to expect now anyway?
Again, it’s rational to expect us to get at least $ 30,000. Near $ 30,000 is huge confluence in the form of a point of control volume profile, 100 weeks moving average and originally resistance trend diagonals.
In conclusion
As soon as we return to close to $ 30,000 and see further rebounds, it will, of course, be a strong confirmation that the bulls are still willing to defend these levels. We just need to monitor the signals that will confirm our willingness to support.
In addition, it is very unlikely that the 100-week moving average will fall on the first test. Rather, it is better to expect a similar market reaction as at the turn of spring / summer last year. At that time, it was just a 50-week moving average.
ATTENTION: No data in the video is an investment board. The analysis does not try to predict future price developments. It serves exclusively as educational content on how to approach the market. Before you invest, do your own research and analysis, you always trade at your own risk. The kryptomagazin.cz team strongly recommends individual risk considerations!
–


