
Bitcoin (BTC) advanced a little bit again. It wasn’t a pump, but the price only got a few hundred dollars from the current all-time high. The process has therefore stopped here. Thanks to that, one thought occurred to me, which may come true over time, or even in the next few hours, it will be invalidated.
Bitcoin dominance
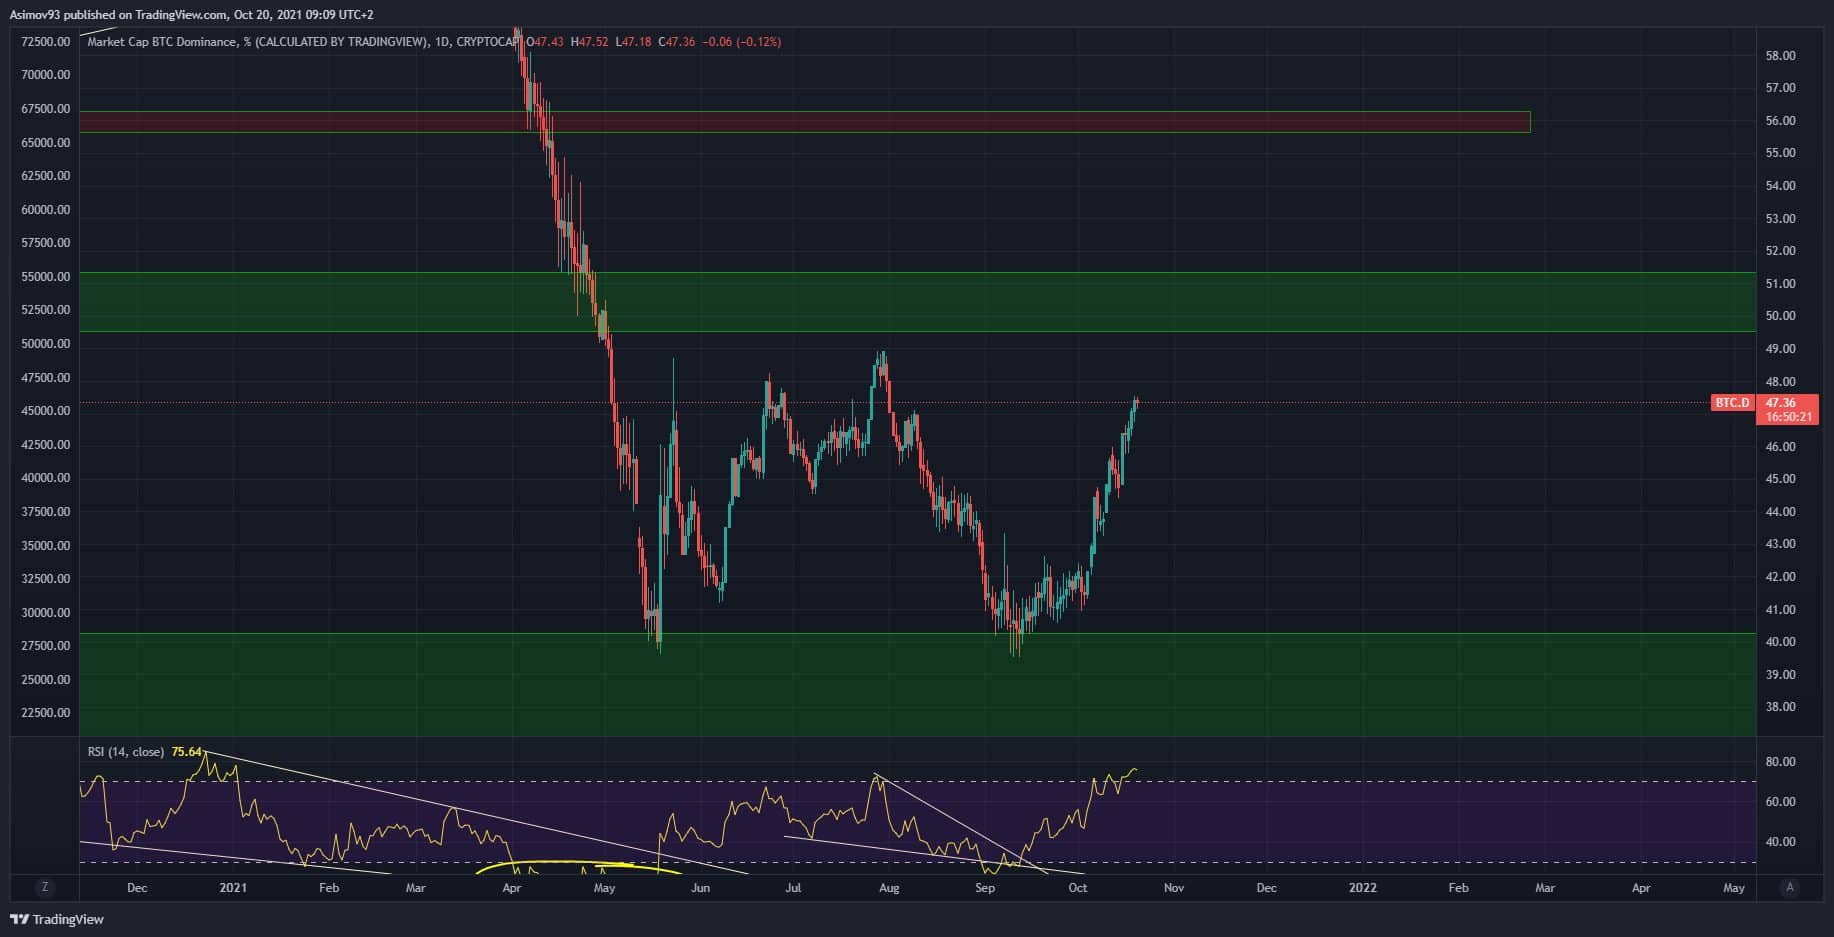
It is now very important to monitor Bitcoin dominance. Dominance for several weeks constantly strengthens, which naturally sucks up altcoins. However, it vacuums them much more and for a relatively long time than I remember from earlier periods. In any case, altcoins will have their opportunity when dominance approaches 50%. Now the dominance is about 47.5%.
It can take several days before we climb to about 50% of them. Even for a few weeks, it will depend on the dynamics of development. However, I personally assume that when there is a definitive breakthrough on the new ATH, the dynamics will be maximum. Therefore, alts could wake up in a few days. But again, I note that nothing is certain. There’s still something going wrong.
Current situation at 1D BTC / USD
As for the BTC price chart, the exchange rate finally rebounded from the S / R level of $ 61,000. It was so uncertain, but the market tended to push for higher price levels. So we’ve had it. However, the process stopped again, a few hundred dollars from the current all-time high. It seems unnecessary to me and I don’t really understand why the course didn’t break right away. I didn’t expect a bid pool around the $ 65,000 at all. Holt, if we don’t see something, it doesn’t mean it’s not there.
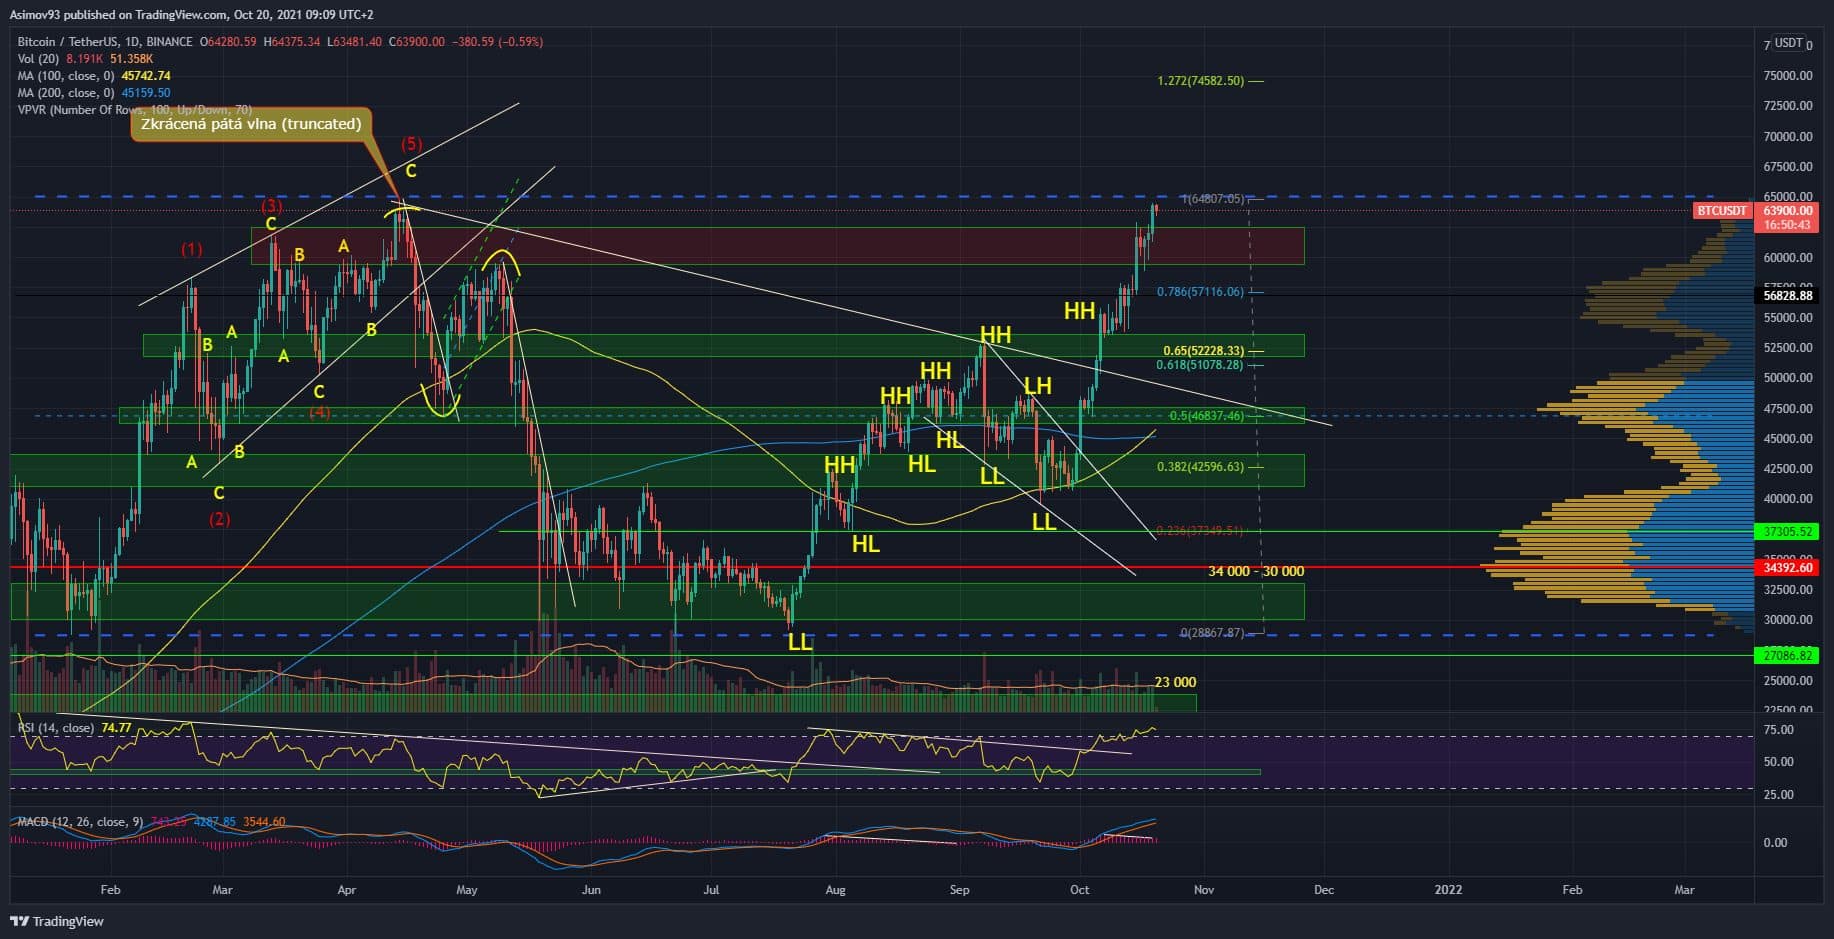
In any case, we should see a resolution soon. We’re right after ATH, so I don’t expect Bitcoin to consolidate here for long. Here I will allow myself one idea that came to my mind a few weeks ago. I plotted the side band, which has a lower limit near $ 30,000, while the upper limit is the current all-time high.
As I said, this scenario can be negated in a few hours. However, there is a possibility that we will remain in the zone until the end of the year. So we’d bounce down and bounce around $ 30,000 again. We are constantly showing such side consolidations, but they are many times smaller.
The described party consolidation would, of course, be either massive accumulation, or vice versa distribution. But that would really have to stop the process now.
Indicators
On the MACD, the divergences are still on the histogram, but the daily RSI looks relatively cool. But even according to this indicator, the momentum weakens significantly. Among other things, we are already quite high and around 80 points there are smaller turns.
In conclusion
Perhaps we will see very soon whether the market will really be able to break through. Bitcoin has come a long way, so it is logical that everyone is more inclined to break through to new historical highs. But as I repeat regularly, something can go wrong.
ATTENTION: No data in the article is an investment board. The analysis does not try to predict future price developments. It serves exclusively as an educational text on how to approach the market mentally. Before you invest, do your own research and analysis, you always trade only at your own risk. The kryptomagazin.cz team strongly recommends individual risk considerations!
–

