–
We have a new week and with it comes regular text analysis on Bitcoin (BTC). As usual, we will also look at the weekly chart. But it will be rather brief, because I dealt with the market quite thoroughly in Sunday video analysis. In any case, as the title of today’s post suggests, a potential signal is forming at the weekly RSI, which we must not forget.
Try Saturday’s educational article at Quantitative easing – how does this central bank tool work?
Current situation at 1W TF BTC / USD
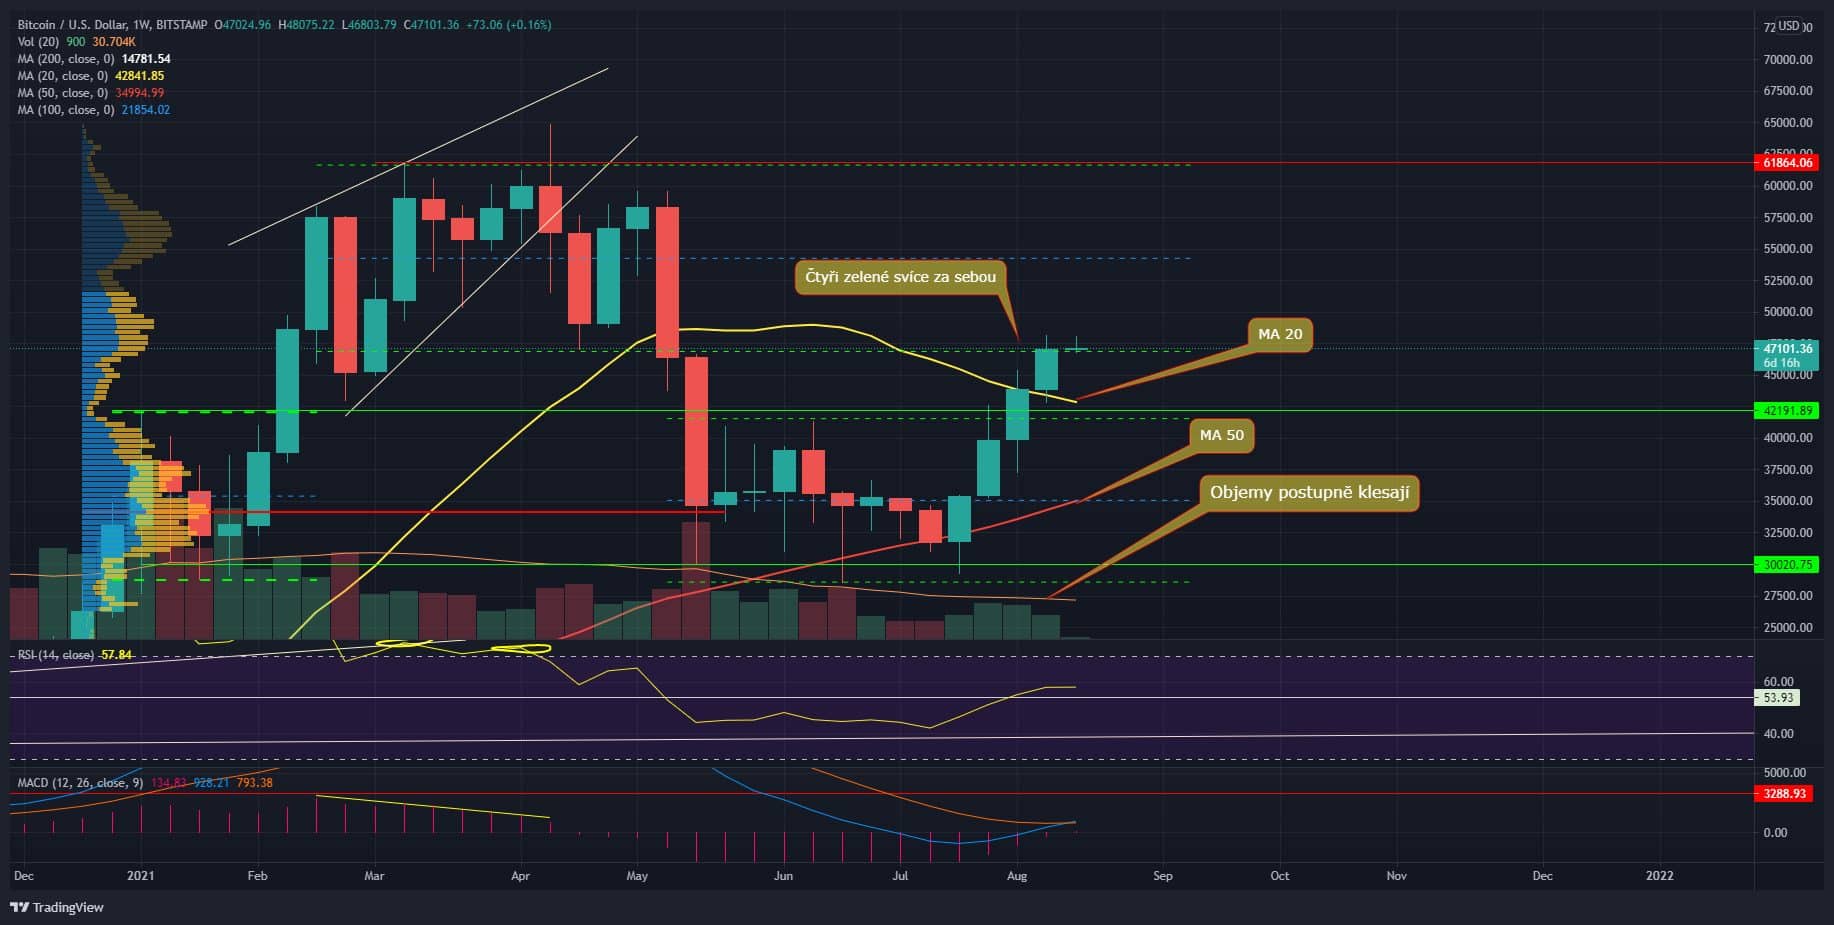
So let’s start with the weekly BTC chart, where we have the final form of a candle from a freshly closed week. The candle is almost identical to the prelude, so in fact it is bull. In short, price growth is keeping pace, which it really is sparingly. In terms of volumes, they are slightly lower. Thus, volumes have been falling steadily for two weeks, so price movements is not confirmed in this respect.
The weekly close is at $ 47,000, so this candle is also a factual breakthrough. Volume confirmation is simply missing. Previously, this factor was visible on a daily time frame, now on a weekly basis. In any case, we have a definitive weekly close over MA 20. Last time it was not so clear, but now there is no doubt.
Indicators
The RSI is just below 60 points, so according to the weekly chart, the market has not gone that far again. On the weekly MACD, however, there is a bullish cross, or rather the curves have already crossed. However, it is reasonable to wait until the end of the week. But the bullish cross is a very positive signal without any debate. We’ll see what the lower time frames do.
Current situation at 1D TF BTC / USD
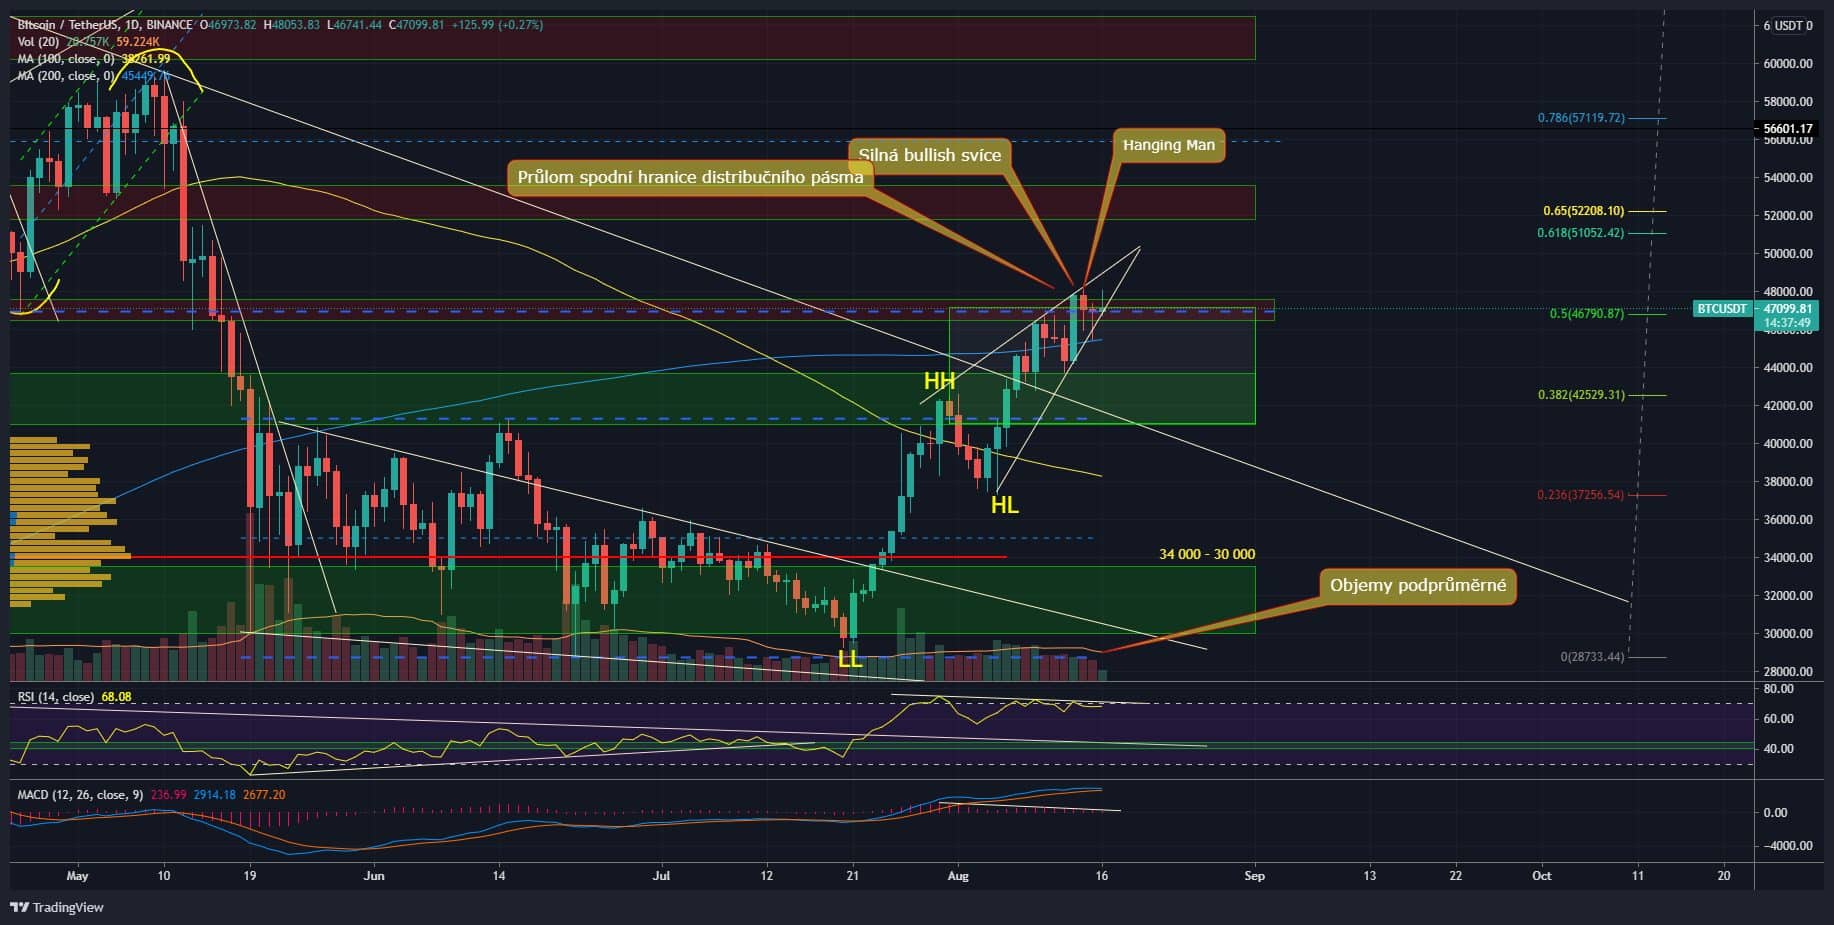
As for the daily BTC chart, I forgot to mention one very important thing in Sunday’s video analysis. Saturday candle has the form Hanging Man. This is a lot of bear candles that appear at the peak of the trend. So it’s also a reverse candle. Which, of course, doesn’t mean we’ll turn down right away.
But indeed the probability is increased. Again, on the other hand, Hanging Man has low volumes. The volumes of the identified candle also have their weight. If the reversing plug has low volumes, its severity decreases. Respectively, the market does not have to respect it at all, and it will go its own way anyway.
Today’s candle still has the form of an ordinary one Doji. In short, as soon as the price returned above $ 47,000, a strong offer appeared immediately. It is now clear that there is strong resistance around the $ 47,000, perhaps much stronger than it originally appeared. At first I thought the strongest level was $ 42,000, but now I would say I was wrong.
So let’s see how today’s candle closes. If the daily closing price ends below $ 47,000 again, we get another bad signal. It is therefore very important for Bitcoin to be able to stay above this level. Not to forget volumes are getting lower and lower, which is also not a good sign.
Indicators
There is still a double bearish divergence on the daily RSI, and if a higher daily closing price is created, it will be a triple divergence. The same is true for the MACD histogram.
In conclusion
There is quite a strong contrast in both graphs. While the weekly chart looks more like a bull, the daily chart looks like a reversal. Respectively, on the weekly chart, I have a pretty big problem with those declining volumes, but that’s about it. But the daily chart suggests that a break may occur soon. In any case, the steadily declining volumes tell us that something big will happen soon. Let’s wait for it.
ATTENTION: No data in the article is an investment board. Before you invest, do your own research and analysis, you always trade only at your own risk. The kryptomagazin.cz team strongly recommends individual risk considerations!
–


