–
As said in yesterday’s analysis on Bitcoin, the market has spilled over, so it’s probably time to dismantle Ethereum (ETH). If I remember correctly, in yesterday’s live stream I mentioned that altcoins dropped quite the same as Bitcoin. Which is weird, because the sensitivity to greater BTC volatility tends to be much greater. Does this mean that a similar price action will be repeated? No, in general, altcoins bleed much more.
Current situation at 1W TF ETH / USD
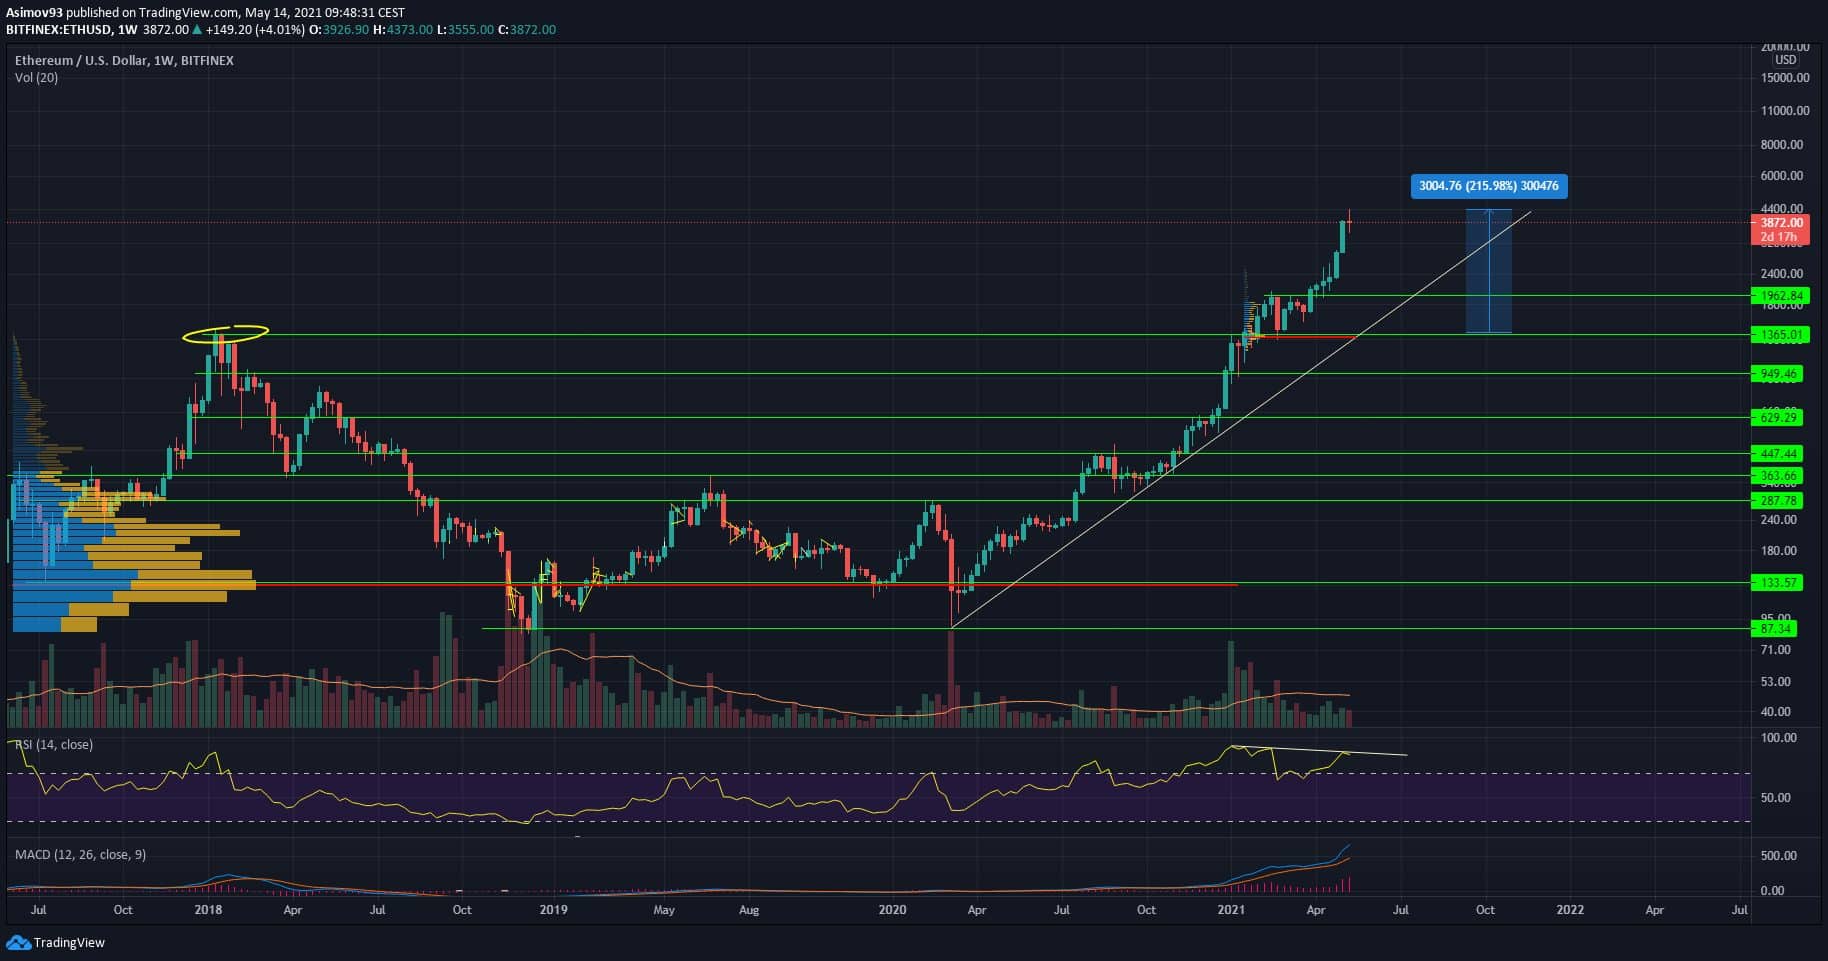
First we will analyze a weekly graph with a logarithmic scale, where we have a nice uptrend with ETH. Overall appreciation from the all time high level of the cannon to 216%, which is of course a decent result. As for the last two weekly candles, they are undoubtedly bullish, but they are certainly not confirmed since they simply lack volumes.
As for the current week, we can only observe that there has been some hesitation. However, there is still plenty of time until the end of the week, so the final shape of the candle can be surprisingly quite different. Otherwise, the first strong level is still up to $ 1,962. The second is the original all time high level at $ 1,365.
The local levels are higher, but you will recognize that according to a higher time frame, there is simply nothing more solid at higher price levels. Therefore, if the market spills a lot, it is appropriate to calculate that the decline will be in the range of 50 – 70%, which is nothing special in the ETH market.
There have been many similar drops in the past, so it is reasonable to expect that it will be repeated once. As for a bull scenario, it all depends on Bitcoin now. There may be some room for Ethereum, but the financial risk is still huge. Since last year’s low, there has been an appreciation of about 5,000%. Do you think that Ethereum can make another 5,000% of the current price? I think everyone can answer this question on their own.
Indicators
At the weekly RSI, there is still a double bearish divergence, which logically threatens its application. Cose is about MACD, so it’s without anomalies.
Current situation at 1D TF ETH / USD
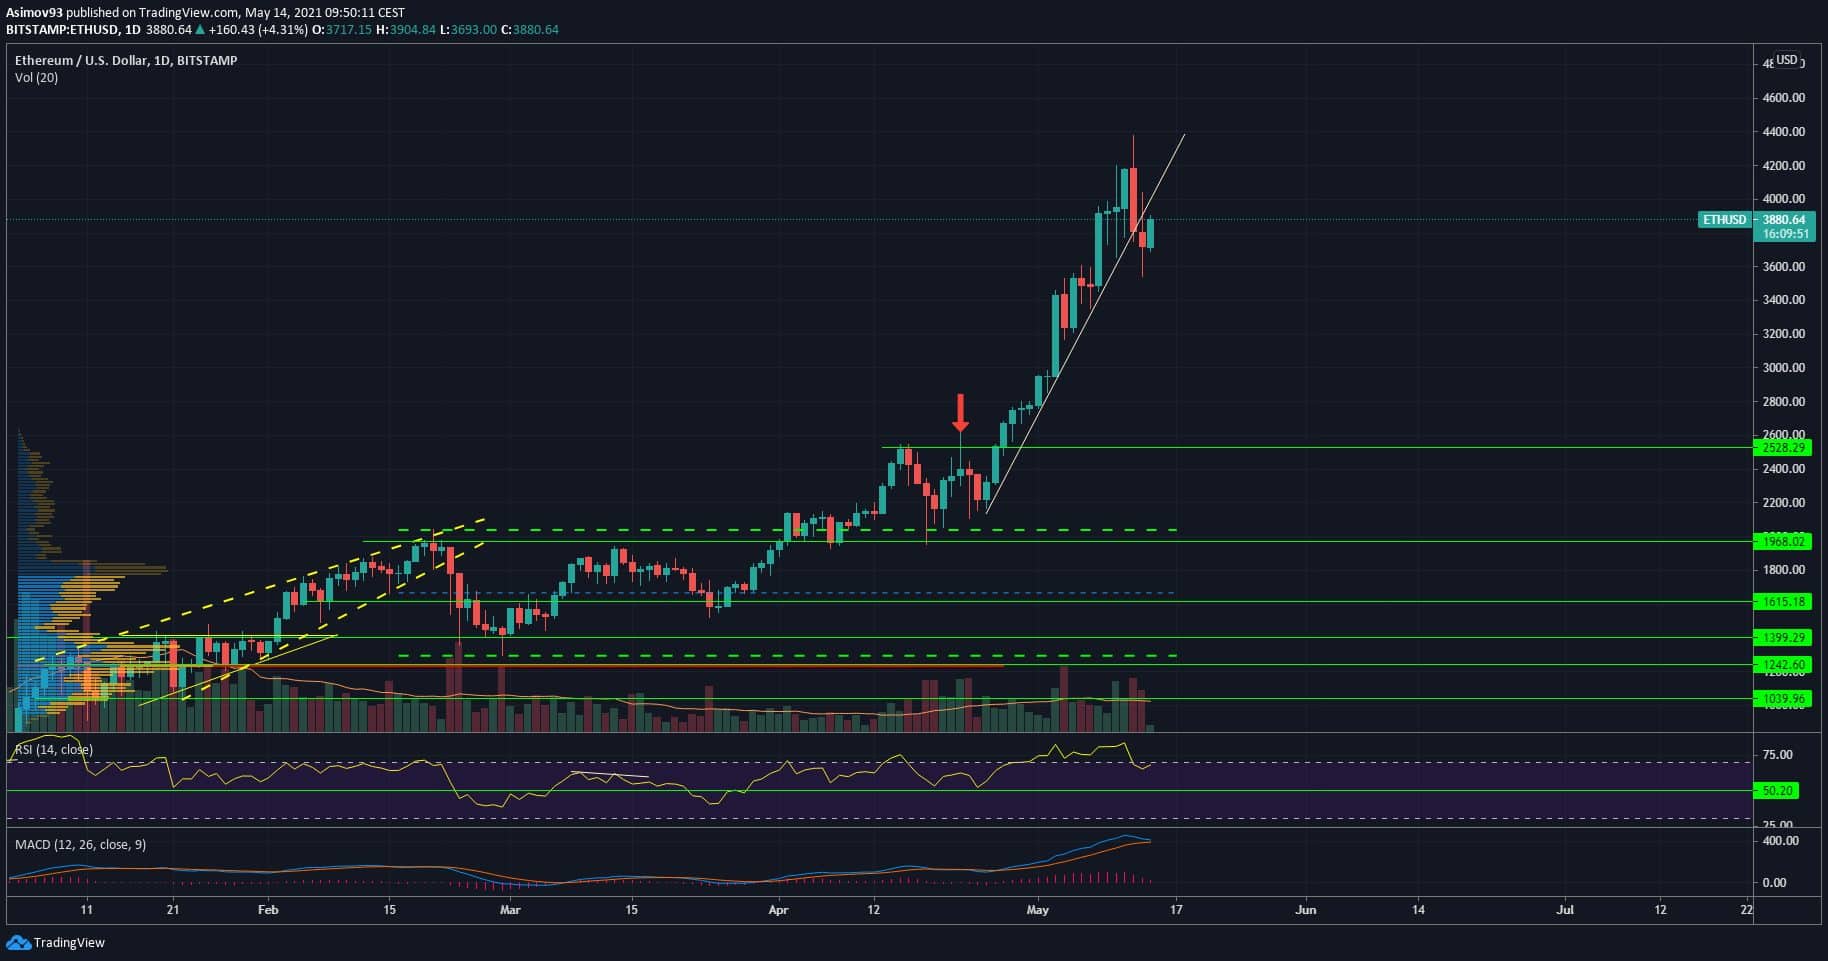
We will also take a quick look at the daily chart, where some local levels are also marked, with the closest being up to USD 2,528. Furthermore, we can observe an aggressive uptrend, which, however, is beginning to break. So far, it is not entirely certain, but with this fresh drop, the growth structure has been disrupted to a certain extent and its existence is therefore endangered.
Popularly speaking, the course still has a chance to return above the diagonal, which will fix the structure. Until then, however, market conditions are all the more risky. As for the selling pressure, the pressure of buyers is noticeably stronger. So even though the price can go up, it’s with a big exclamation mark. In any case, even on the daily chart we can see that the bears are really quite aggressive.
Indicators
Daily RSI is without an anomaly, but it is clear from previous developments that positive inertia has run out of breath. Currently, there is an effort to restore momentum up, but so far no significant progress. On the other hand, there is a risk of a bearish cross on the daily MACD.
In conclusion
As I have already heard, everything now depends on Bitcoin. In fact, Ethereum still has some room to grow, but I wouldn’t be a big fan of the market being able to make any percentage. That potential is simply gone, so you are at extreme risk when entering. I think patience pays off seriously at this time.
ATTENTION: No data in the article is an investment board. Before you invest, do your own research and analysis, you always trade only at your own risk. The kryptomagazin.cz team strongly recommends individual risk considerations!
–


