
From Wednesday analysis There has been no significant move to Bitcoin (BTC) and so far everything is going as it should logic – the market is consolidating in the range of 42,000 – 47,000 USD. After such declines, it makes sense for the volatility to calm down.
However, it can be assumed that after about 24-48 hours, more movement may come again. However, I do not even dare to go whether we go up or down. But as long as Bitcoin stays above $ 42,000, it can only be a correction.
Bitcoin dominance
It is definitely appropriate to look at the Bitcoin dominance, which still “levitates” over the marked support band, which starts at 40%. This is very important for us, because the marked zone is a historic bottom, which has not yet fallen. Therefore, there is a greater chance that the dominance of BTC will start to grow than that it will go further into the abyss.
Which is the basis of a simple implication. Bitcoin must go up or down steeply. Virtually all “altcoiners” are in danger. The truth is that when Bitcoin pumps, the altos will catch up with him anyway. However, this does not change the fact that the last bull run definitely ended here. It is necessary to reckon with that, to know this fact.
Current situation at 1D TF BTC / USD
As mentioned, Bitcoin is still consolidating between $ 42,000 and $ 47,000. I would rather describe yesterday’s candle as neutral, even though the bottom wick was relatively long. But the red body of the candle itself is not small either. Therefore, I would not dare call it a bull, rather both sides were balanced. Volumes were slightly above average in the summer context.
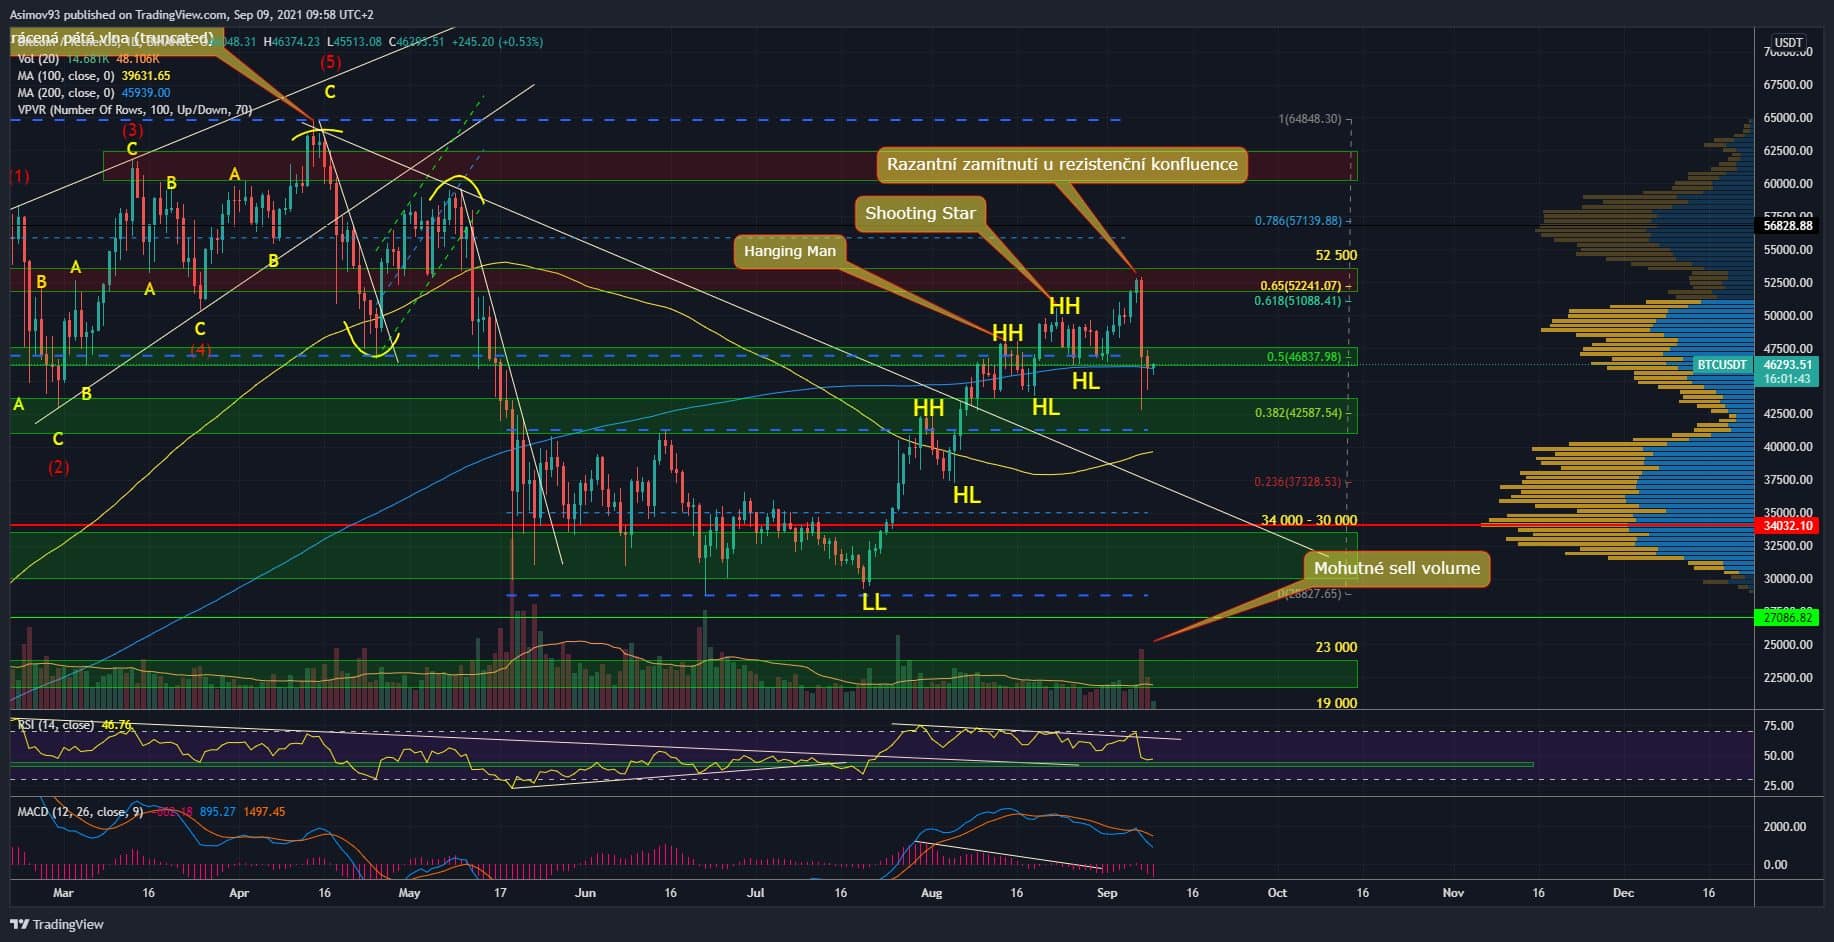
In the lower time frames, it is known that the buyer is trying to push the price up. Respectively over 47,000 USD. If they succeed, they must saturate the band. Historically, this is a fairly significant level, so its occupancy is very important for the shopping party. However, it would not surprise me if the exchange rate consolidated for several days between the already mentioned price range.
Personally, I wonder if the price development from the end of April will be repeated. That Monday’s slump reminds me a lot of April 18th. The price subsequently consolidated for a few days and then continued to decline. At the turn of April / May, the price rose for about two more weeks, but then Bitcoin collapsed.
Indicators
The local bottom of the RSI is at 46 points, which can still be considered bullish. Levels below 40 points are a problem. Otherwise, the series of divergences is naturally applied and we may no longer be interested. There is still a negative momentum on the MACD, but it’s not that strong at the moment.
In conclusion
Some started shopping immediately after the slump, which seems extremely unreasonable to me. Blindly catching dips can take over when it turns out we are in a bear market. Yeah, in the bull run, it worked great. But now he doesn’t have to. If this was just a correction, it needs some confirmation. Best pulse candles at least on a 4H chart and tremendous buying pressure to do so.
ATTENTION: No data in the article is an investment board. Before you invest, do your own research and analysis, you always trade only at your own risk. The kryptomagazin.cz team strongly recommends individual risk considerations!
–
 fears this examination more than the cancer diagnosis")
