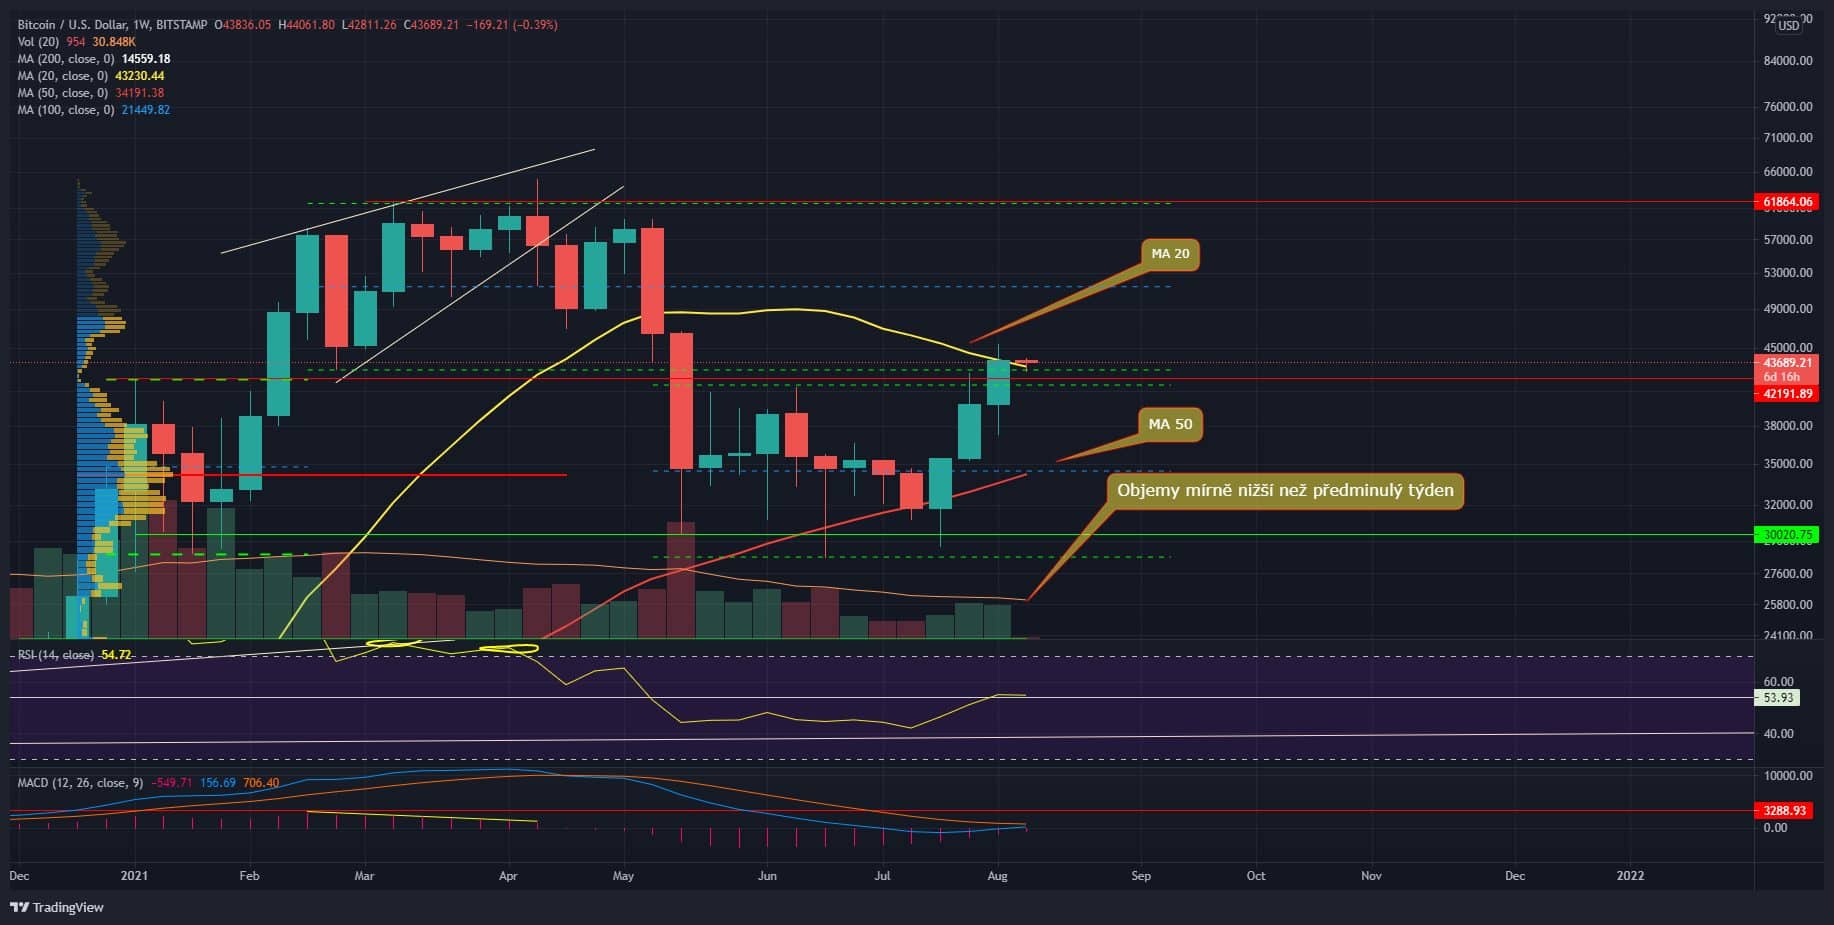
V Sunday video analysis we said that Bitcoin (BTC) is very close from the weekly close above the important moving average – MA 20. And indeed the close above this moving average has taken place, but it has one catch, which I will explain in a moment. In any case, Bitcoin looks good and is set for further growth. Unless it turns out this week that it was fake breakthrough.
Will the screws be tightened soon? And what about Bitcoin?
You may have noticed that the gold has spilled terribly. The information flow shows that this allegedly happened on the basis of growing concerns about the subsequent monetary policy of the Federal Reserve Bank. Respectively, the Fed is expected to pick up rates and reduce volumes within quantitative release much earlier than we would expect.
Personally, this news did not surprise me, and it should not surprise you either, because I have said many times that the Fed’s current policy is somewhat bizarre and that no one trusts them much. Which was reflected in the fact that gold went down, and conversely, the bond market was supposed to. From the price developments in the markets it was clear that investors expect earlier tightening of screws. Much earlier than the Fed announces.
And expectations have a huge impact, it is the biggest driver. However, if rates are raised soon, it will certainly have a negative effect on Bitcoin. However, it depends on whether the increase occurs really unexpectedly or on the size itself. If they resort to this, they will probably not dare to increase rates by more than 0.25 – 0.5 pp, which would not necessarily trigger armageddon.
Current situation at 1W TF BTC / USD
As I said in the introduction, Bitcoin on the weekly chart closed over MA 20. The problem, however, is that the weekly close was about $ 20 above the moving average. By that I mean that I am not sure whether the market takes it as a definitive breakthrough or as a mere testing.
Dynamic S / R levels in the form of moving averages are exact numbers, in contrast to static S / R levels, which we mark in the graph according to subjective assessment. If the market sees this as a bullish signal, it should show soon. At the moment, it is also trading above MA 20, so if the daily closing price is somewhere above USD 43,232, the market could respond with further growth.
As for the shape of the weekly candle and the volumes, they are ok. The candle is definitely bullish a volumes they are almost identical to last week. It would be better, of course, for volumes to rise, but similar volumes are certainly not a difficult problem. In Sunday’s video analysis, however, I pointed out that the volume is quite average in the long run.
Which tells us that there isn’t much capital in the market yet. For Bitcoin to be able to keep prices rising, it simply won’t be possible without big players.
Indicators
The weekly RSI stays above 50 points after a long time, which is definitely bullish. In addition, the weekly MACD is approaching bullish crossu, just one growth week and the signal is born.
Current situation at 1D TF BTC / USD
As for the daily time frame, Bitcoin has broken through most of the obstacles to resistance confluence – MA 100, price resistance 42,000 USD, Low Volume Node, resistance diagonal, fibo 38.2%. Missing to break through only MA 200 and the whole resistance confluence will be broken, which will dramatically increase the chances of further progress.
In any case, I have marked in the chart the range of 40,000 – 47,000 USD, from which the price must come. While we’re here, risk stocky bull is high. Plus, the $ 47,000 is resistance in itself – High Volume Node. The next hurdle is the S / R level of $ 52,500, where there is also confluence, but much weaker than around $ 42,000.
Indicators
It’s still on the daily RSI bearish divergence. A minimum of $ 47,000 needs to be broken through for a reversal. This divergence just suggests that the $ 40,000- $ 47,000 range is a bull trap. The market therefore has two options – to apply or invalidate divergence.
The application itself can mean a drop below the observed confluence, which is automatically a problem for BTC. Conversely, reversal of divergence is a strong bullish signal.
In conclusion
It is now crucial for Bitcoin to stay above the $ 42,000 support band. If he manages to do so, the probability of continued price growth is much higher. Keep in mind, however, that overall the volumes are average and especially the divergence on the daily chart can result in a big problem.
ATTENTION: No data in the article is an investment board. Before you invest, do your own research and analysis, you always trade only at your own risk. The kryptomagazin.cz team strongly recommends individual risk considerations!
–


