
And Yesterday’s analysis on Bitcoin (BTC) I said that in case of more movement I will do a little update. Since the dump was massive, I decided on another big analysis, where we look at the daily, 4H and 15m time frame. I suppose the most common question now is whether the correction is over.
I don’t think so yet. Respectively, I also reckon that the gap of around USD 9,700 will be filled. We are already very close and it would be quite strange if the fall of the course stopped just before that and went up. However, once that gap is filled, I don’t see any problem at all for Bitcoin to follow the expansive trajectory.
However, I would like to recall once again my hypothesis about a distribution that could have lasted between August 11,200 and 12,000 USD throughout August. If a big player has been distributing in this range for a really long time, then we should at least count on the possibility that the drop will be much deeper in the end.
Current situation at 1D TF BTC / USD
After the daily close, the loss on Bitcoin is about 12%, which was somehow expected. It is worse on the alts, when some lost several times more. Anyway, the exchange rate went quite easily through the S / R level of $ 10,481 and stopped at $ 9,934. It was to be expected that if the first level mentioned fell, the defense should be more courageous on the second one.
However, if the market is going for that gap, then the nearest stop is somewhere around 9,458 USD. If we start from that gap, we simply have another “leg” waiting for us. We’re pretty close, so it wouldn’t be a big drop and it would benefit. Simply having a large gap in the market is nothing friendly and it is better when it fills up.
Indicators
At RSI, there was a minor rebound to about 32.7 points, so we have not yet touched the purely technical borderline 30 points. However, it was possible to count on an effort to defend these point levels. However, we will see how long this initiative lasts. As for the MACD, if the momentum doesn’t soon switch, we go into negative values.
Current situation at 4H TF BTC / USD
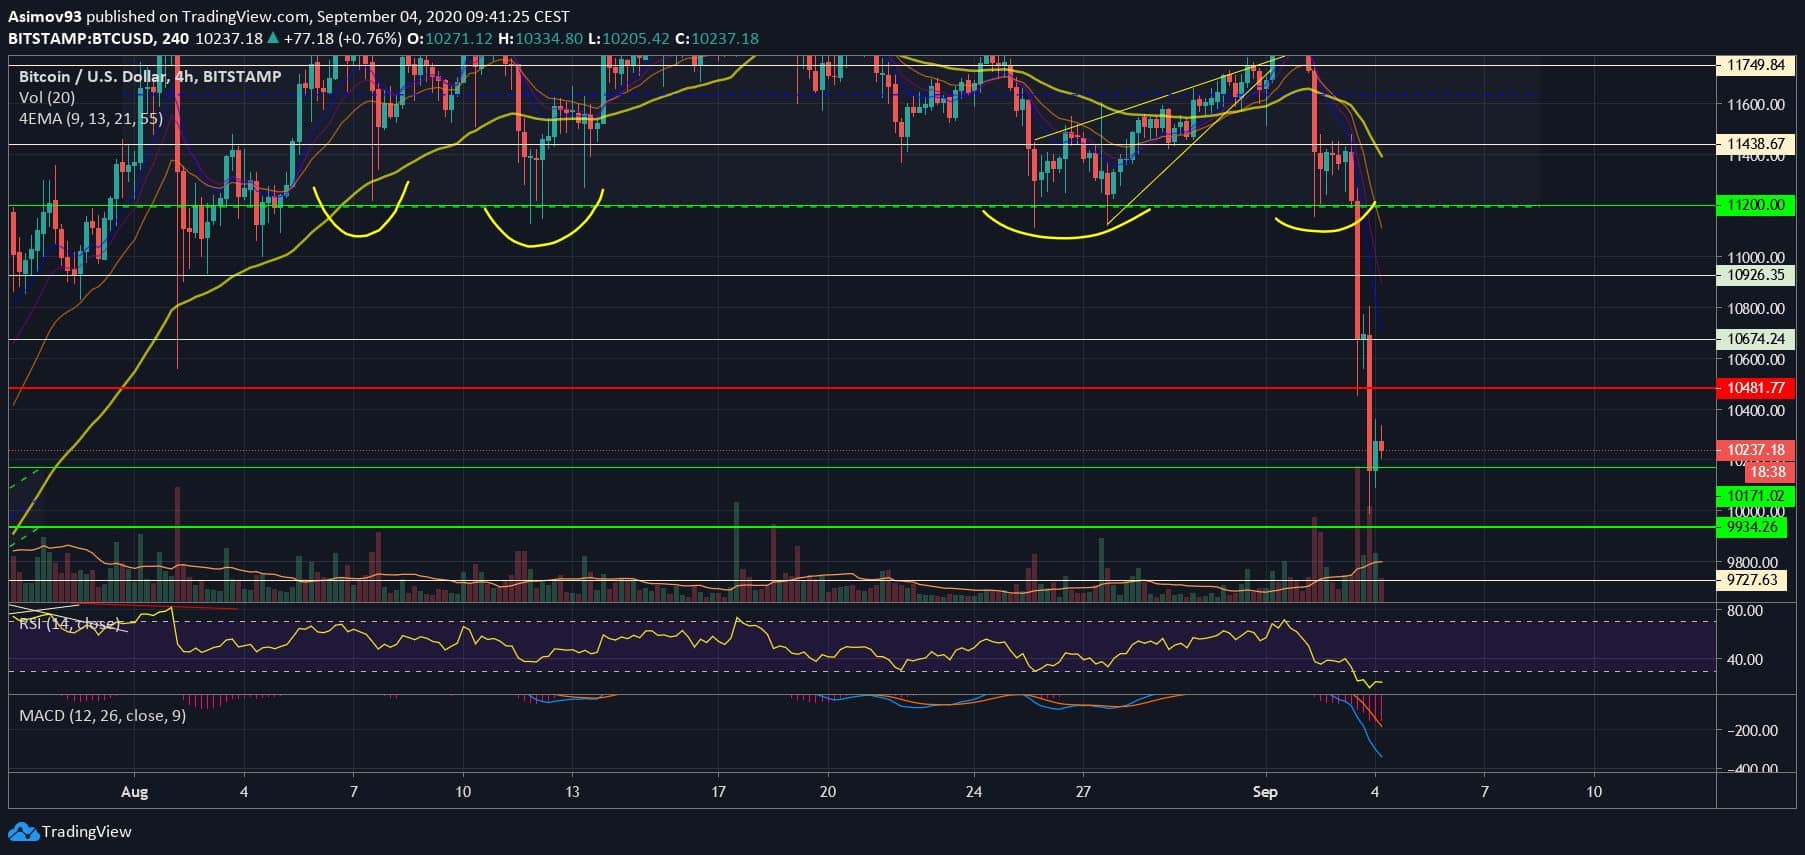
Now let’s look at the 4H time chart, where we see that the detonator for the next fall was the inability to break the S / R level at $ 11,438. As I warned yesterday, the bulls lost all motivation to defend the $ 11,200 and simply let go, launching a cascade of sales. Because below the last mentioned level, a substantial part of traders had their stop losses.
There was a positive reaction up to $ 10,481. It was a pretty decent reflection, but in the end the positive momentum failed to prevail at all. Thus, the price decline then regained its grades and the exchange rate fell to close to the S / R limit of 9,934 USD, where there was a similar reaction as at the previous level.
It is definitely very sensible to wait for a signal now, because it is not at all clear whether another “leg” will come down. We need much more than just an automatic response to the support that is expected. So far, it doesn’t even have convincing buying volumes when the exchange rate goes up.
Indicators
The bottom is 17 points on the RSI, so the market certainly got a nice tailspin. Unfortunately, from the point of view of 4H RSI, it only looks like an automatic reaction, after which we will continue to decline. As for the MACD, the values of this indicator fell the deepest since March this year. We should definitely not underestimate the current drop in any way because of this.
Current situation at 15m TF BTC / USD
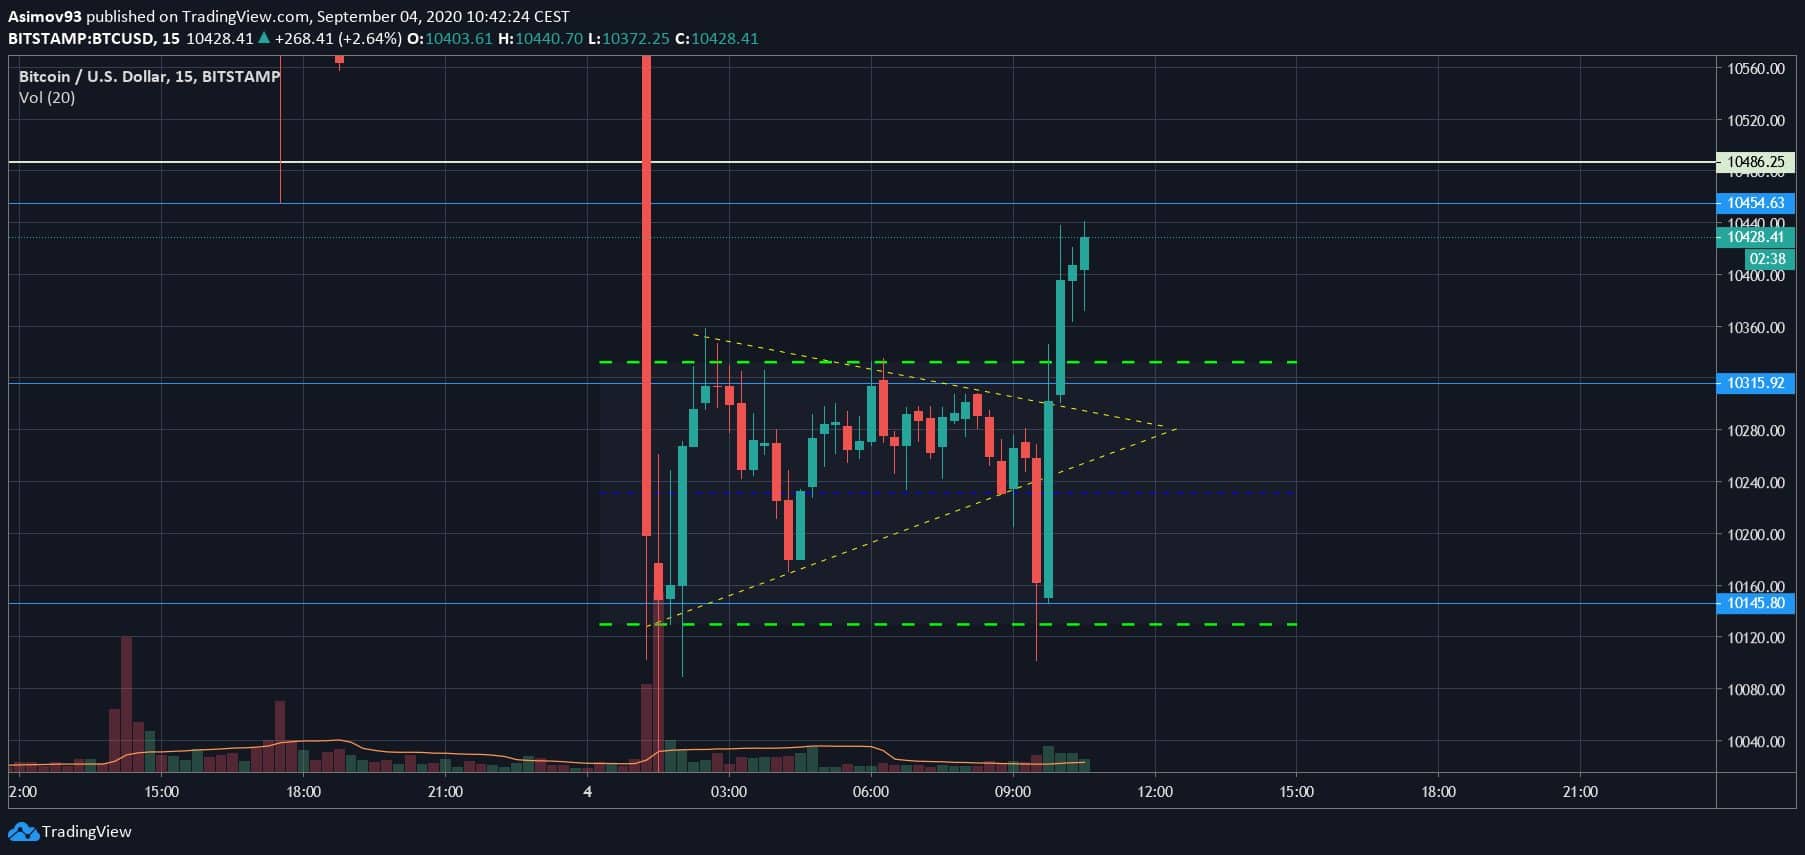
There was a bear pennant on the 15m chart, from which the odds spilled, but in the end a double bottom was made on the support. Thanks to that, the price was quite solidly pumped (from the point of view of this time frame), but at the moment it cannot be considered anything other than a simple pullback to the 10,500 USD.
In fact, there is a considerable risk that within the pullback, the level is tested and bounces down. This will turn the former strong support into strong resistance.
Conclusion
As I have already said, I calculate that the market will enforce the filling of the CME gap. As a result, the exchange rate is likely to fall by at least some $ 9,458. Of course, it cannot be completely ruled out that shoppers will be able to defend the current levels.
For me, of course, this is a possibility with a lower probability. We can only say with certainty that we need confirmation and we do not have that yet. That’s why it’s definitely not worth being impatient.
ATTENTION: No data in the article is an investment board. Before you invest, do your own research and analysis, you always trade only at your own risk. The kryptomagazin.cz team strongly recommends individual risk considerations!
–
:quality(80)/cdn-kiosk-api.telegraaf.nl/e69d5776-ef4a-11ea-9bdf-0255c322e81b.jpg "Half of the Dutch fear foreign influence on elections | Inland")
