–
We have a new week, which automatically means analysis on Bitcoin (BTC). We did not deal with Bitcoin in text form for several days, we just prepared a short summary in the form yesterday’s video analysis. Since July is over, we will look at the monthly chart in addition to the weekly chart.
Current situation at 1M TF BTC / USD
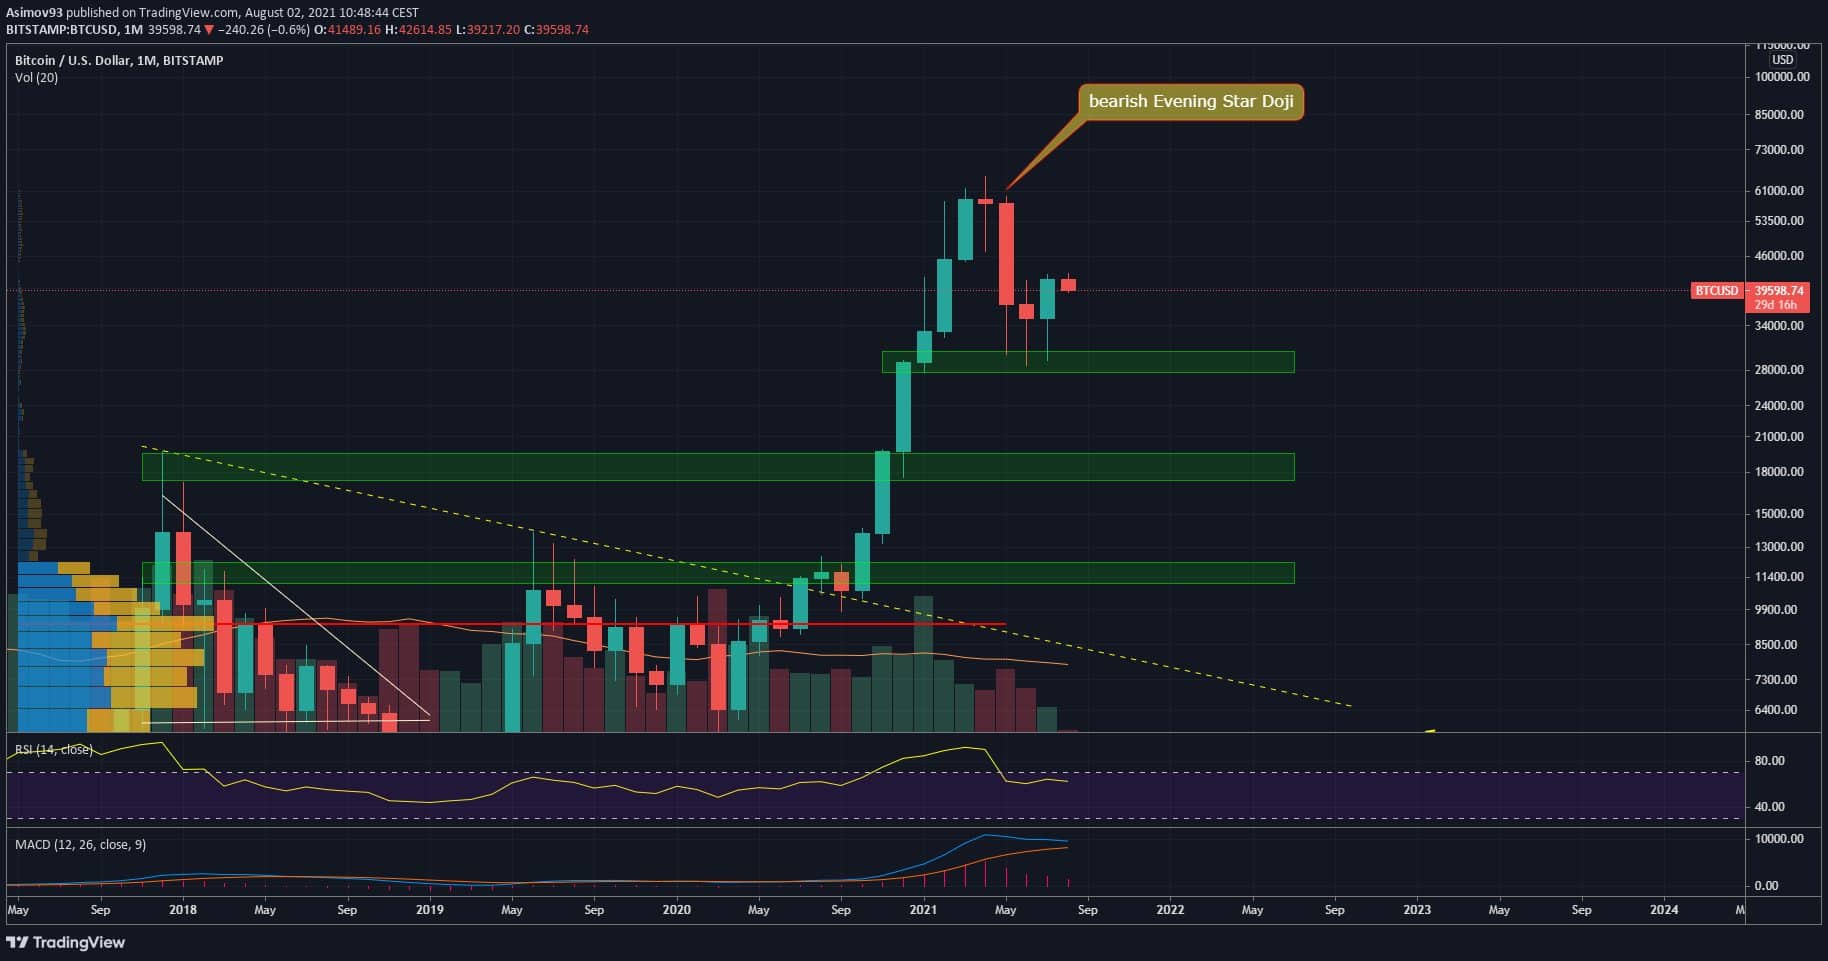
We will start with the monthly chart, where we must definitely praise the shape of the July candle. In connection with the previous two candles, it is also possible to observe on the monthly chart that the market uses the USD 30,000 as a springboard for rotation course. Which is certainly a good sign when the described initiative is easy to see even in such a high time frame.
In addition, we know that Bitcoin does not want to go through key support of $ 30,000. This is therefore a very strong level. Respectively, the $ 30,000 has been confirmed to be a level that works as a result over the last many weeks reliable defense before another slump. Which is a fact we couldn’t have known before without much testing.
In fact, this support was created in front of our eyes for months. As for the July candle, it is negative that its volumes are so low. The last time the Bitstamp was so low was sometime in 2016. So I looked at the other big exchanges and the index for Bitcoin (BLX).
In other markets, the situation is not so bad, but in general, in general, it is one of the weakest months of recent years. The current summer holidays are really extremely weak. Therefore, the good question is whether to take the last reflection from $ 30,000 seriously. In fact, I wonder if the whole summer holidays can be taken seriously.
If you are wondering why, I have a parallel with the pre-market in the classic financial markets. In the pre-market, volumes are also very weak, so it is prudent to keep price developments reserved until the whole market opens completely. The more orders, the more authoritative the development.
Current situation at 1W TF BTC / USD
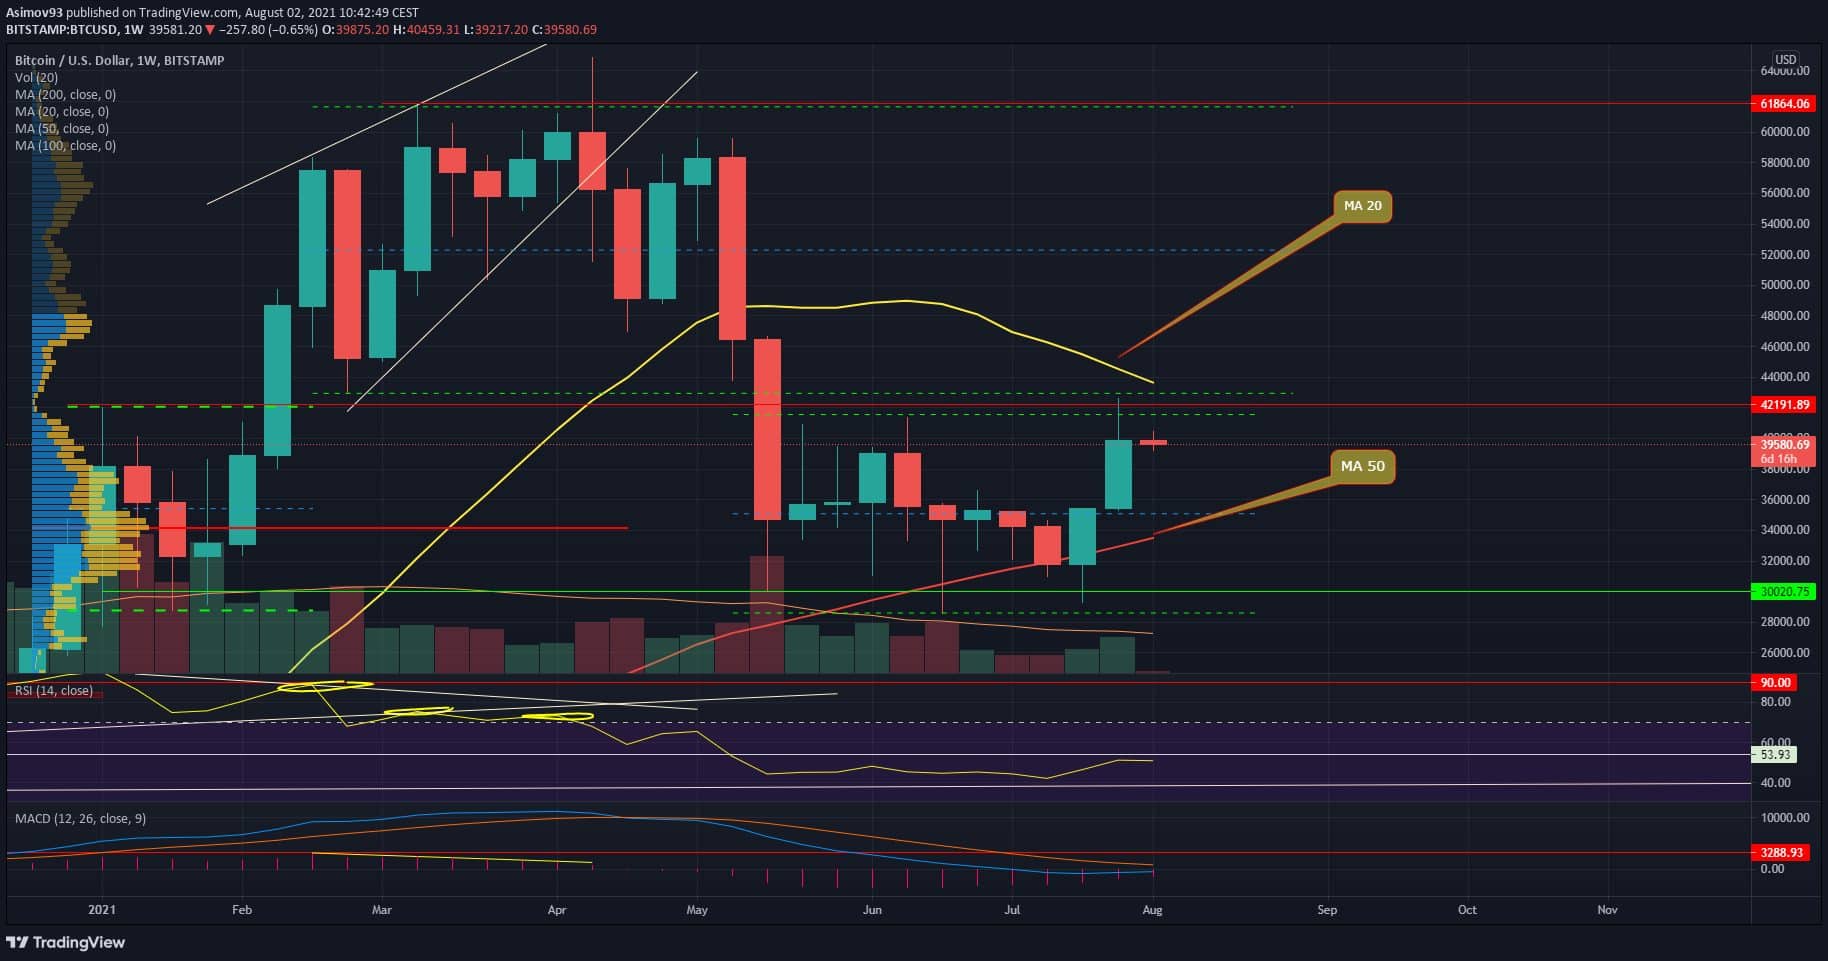
It is also clear from the weekly chart that $ 30,000 is acting as strong support that it can simply rely on. The appearance of the candle as such is good, but it spoils the upper wick to 42,000 USD. Even the weekly chart somehow shows us that $ 42,000 is a level that we have to calculate as with quite strong resistance.
Then we have slowly growing volumes, which we can certainly acknowledge. The previous week was relatively enough dynamic and the market has been missing enough for several weeks. The dynamics just mentioned cannot do without growing volumes. In any case, the course surpassed the June peak and we even almost tested it 20-week moving average (MA 20).
Bitcoin therefore has at least some progress. From a technical point of view, however, it has not gotten anywhere yet. In order to state that Bitcoin has really technically shifted, we need to have a weekly closing price above $ 42,000 and preferably above MA 20. As volumes increase in the future, buyers will be more likely to make technical changes.
Indicators
RSI returned over 50 points after many weeks. If the weekly RSI lasts in the upper half of the values, it is a bullish signal. Otherwise, the MACD is slowly approaching the bullish cross. It will be very interesting to see if the signal is really generated.
In conclusion
From a monthly time frame point of view, it is certainly bullish that Bitcoin is trying to rotate and is using $ 30,000 as a springboard. However, the weak volumes in themselves claim that the movement is not so authoritative, and I am afraid we will have to wait until September. The last weekly candle is solid, volumes are gradually increasing. However, technically, we didn’t break through anywhere by any chance. Patience brings holt roses.
ATTENTION: No data in the article is an investment board. Before you invest, do your own research and analysis, always trading only at your own risk. The kryptomagazin.cz team strongly recommends individual risk considerations!
–


