
Bitcoin (BTC) was hit by tragedy, which I emphasized in Sunday video analysis. But is it really that bad? I always try to avoid being monotonous, and most importantly I don’t want to scare anyone. On the other hand, I don’t want to downplay the April close, which in the chart looks like the final ortel for the bull run, which probably ends definitively at bitcoin. Although it is still appropriate for us to see a breakthrough of that $ 30,000.
Current situation at 1M BTC / USD
The monthly chart honored us with a significant sales signal, which is not good for bitcoin at all. The exchange rate has closed since March / April 2020 20 months moving average (20 MA). We have been following this glider for a relatively long time, at least since the end of January, when it was clear that the mentioned dynamic level works as a strong support.
We recorded exactly the same reactions in February and March – the exchange rate reacted favorably each time close to the moving average. The course then returned above and closed here. April was no different from the beginning – even this time near 20 MA the exchange rate reacted favorably. In the end, however, the exchange rate not only broke through, but the April candle has a clear close under support.
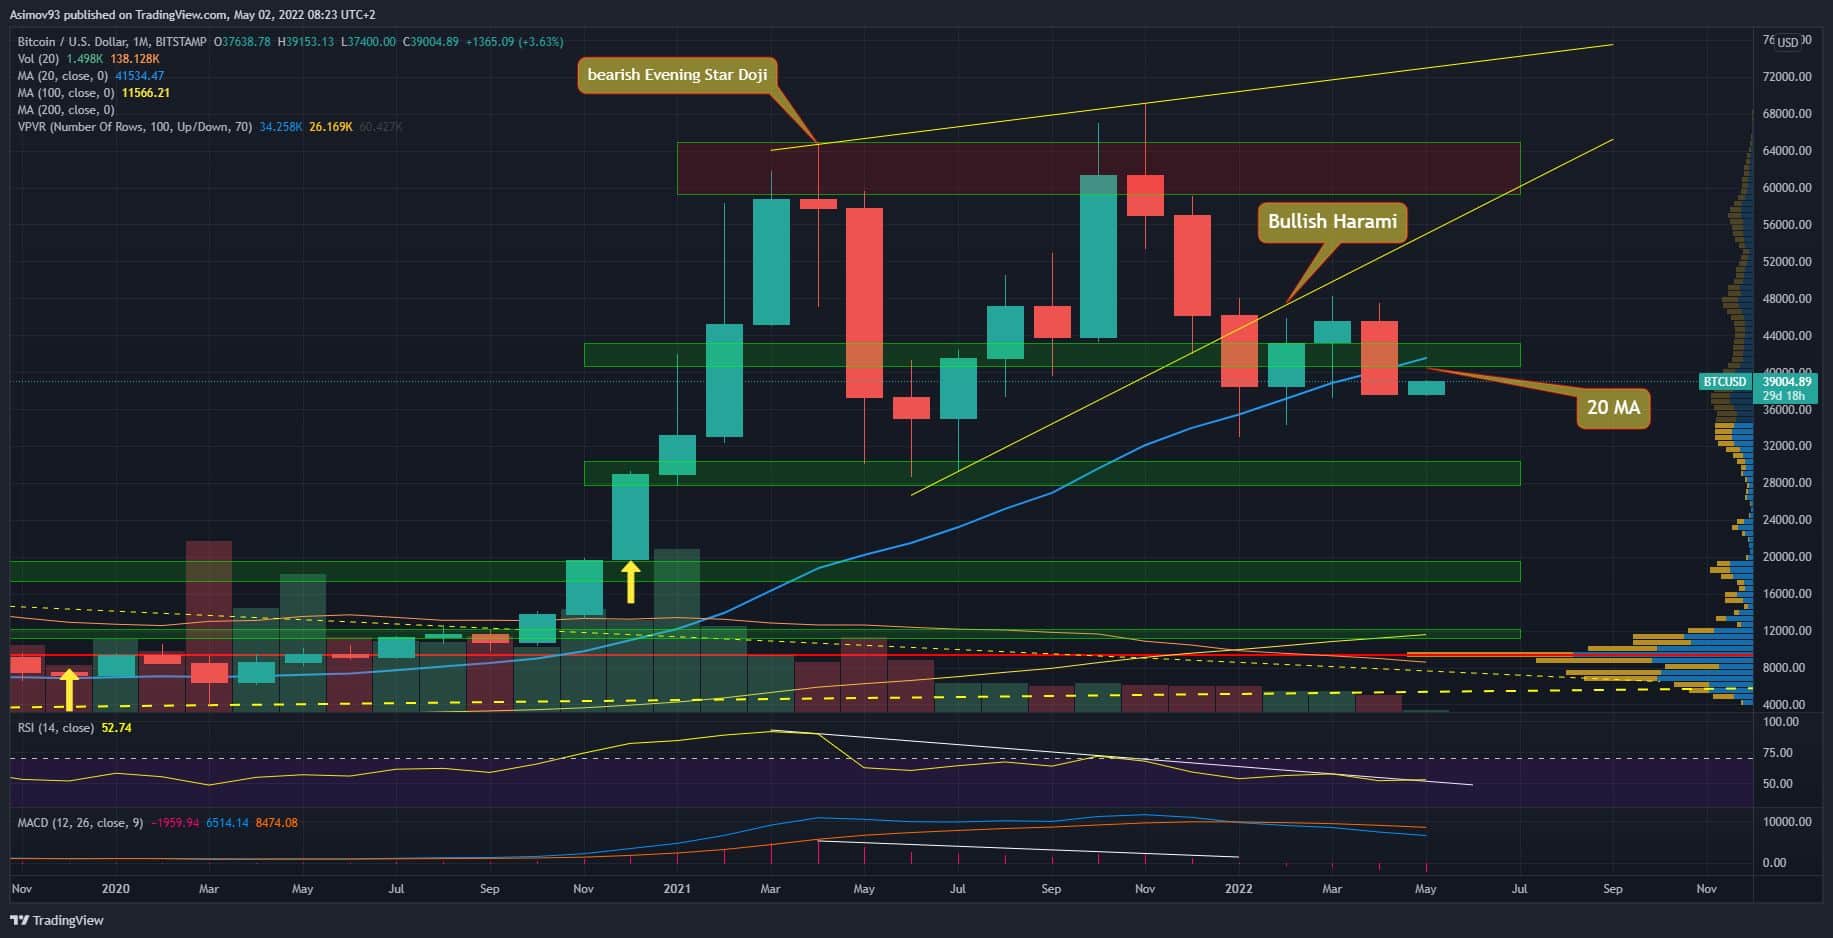
Many ignore moving averages and I think it’s a mistake. This is definitely a significant piece in our big puzzle. Therefore, I really perceive a monthly close below 20 MA as a big problem. Of course, it is advisable to look for confirmation again. For example, in the form of testing the May candle of the original support, this time from below.
So how bad is the situation? If we look at the earlier price action, we find that the breakthrough of BTC below the 20-month moving average resulted in another deep decline. Specifically, I mean the year 2014, the turn of 2018/2019 and the year 2020. Quite frankly, we do not logically have much of that data. But we know from them that so far bitcoin has taken our moving average really seriously – it has often been support and resistance.
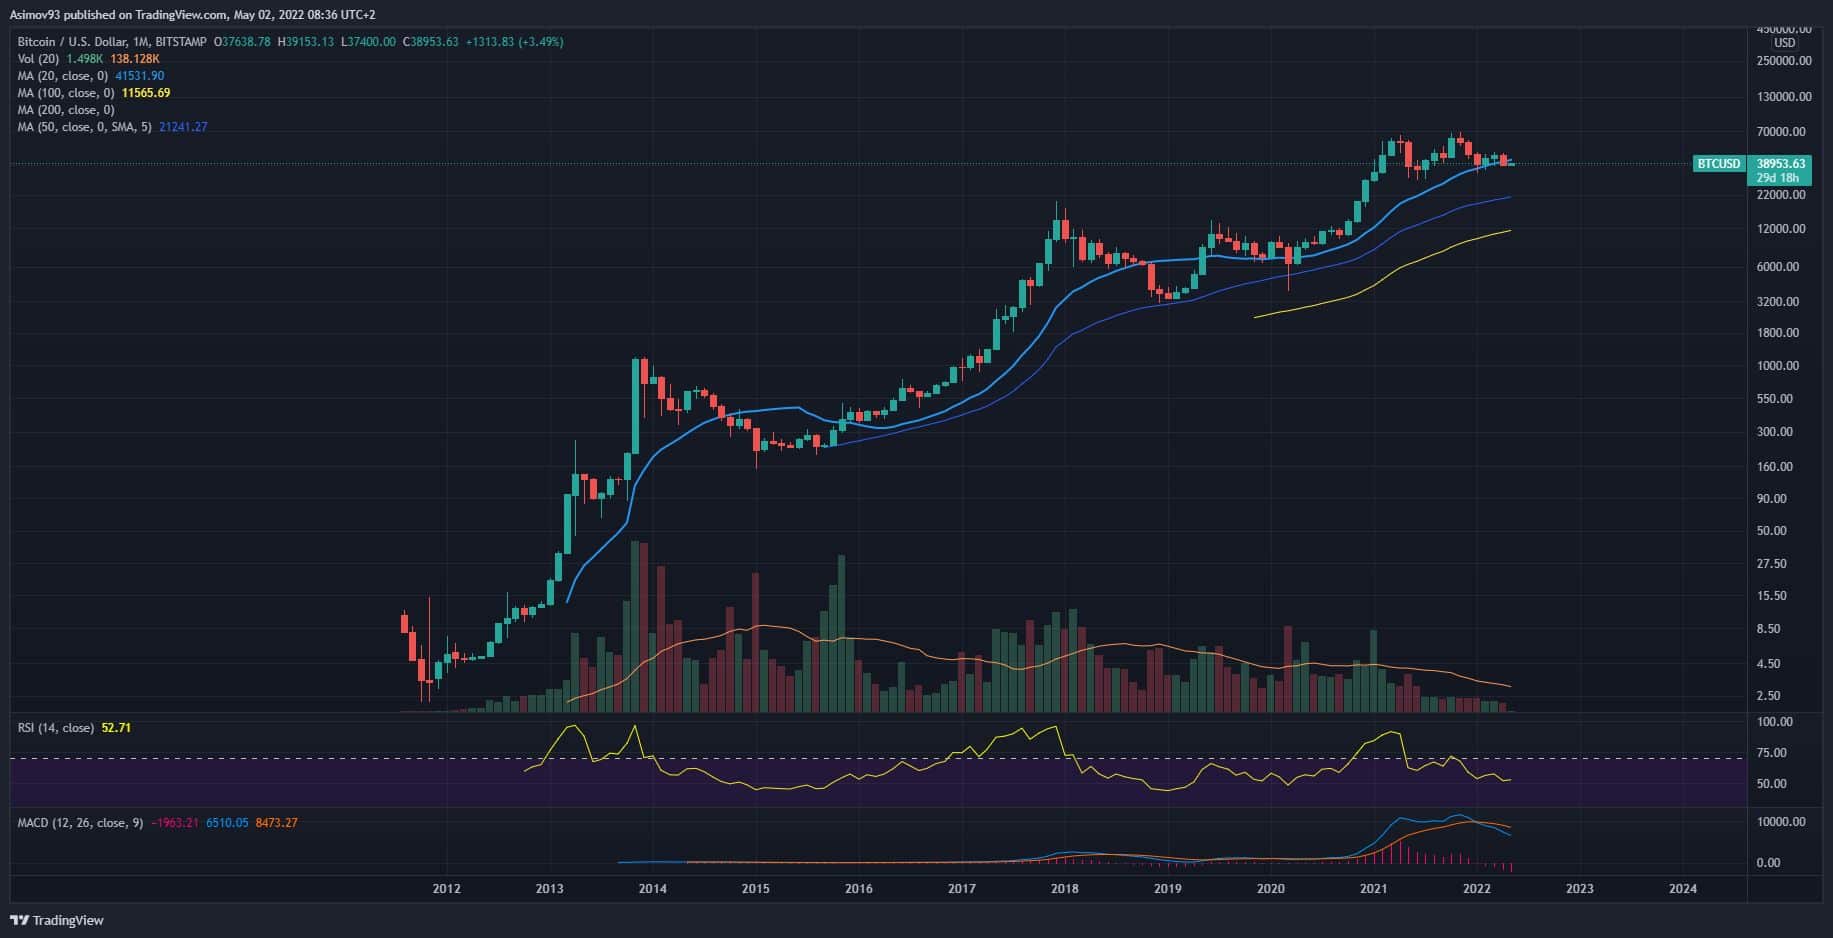
Be sure to note that the fall below the observed moving average did not usually last long. In two cases it was several months. In one case in weeks – the year 2020. Will it be the same now? We can’t count on it, but it’s quite likely. I’ve heard that many times ultimate support I consider levels starting at $ 12,000. In a few months, for example, bitcoin will get there. By the way, near $ 12,000 is also 100 months moving average.
To make it complete, 50 months the moving average is over $ 20,000. Specifically at $ 21,242. It is certainly wise to follow all these moving averages, as I expect similar exchange rate reactions as for the 20 MA.
In conclusion
In terms of volumes, there is a huge contrast to previous years. We have been de facto for almost a year now with volumes at an absolute minimum. What does this mean for us? If you look at bitcoin and its market structure since the beginning of 2021, you will find that we are simply going to the side. There’s something going on in the market. It is either reacculation or distribution. Whatever it is, we have a huge movement ahead of us. And maybe we won’t wait long.
ATTENTION: No data in the video is an investment board. The analysis does not try to predict future price developments. It serves exclusively as educational content on how to approach the market. Before you invest, do your own research and analysis, you always trade at your own risk. The kryptomagazin.cz team strongly recommends individual risk considerations!
–

